
Figure 2. RyR2-E4872Q+/− Prevents Neuronal Hyperactivity of 5xFAD+/− Hippocampal CA1 Neurons In Vivo.
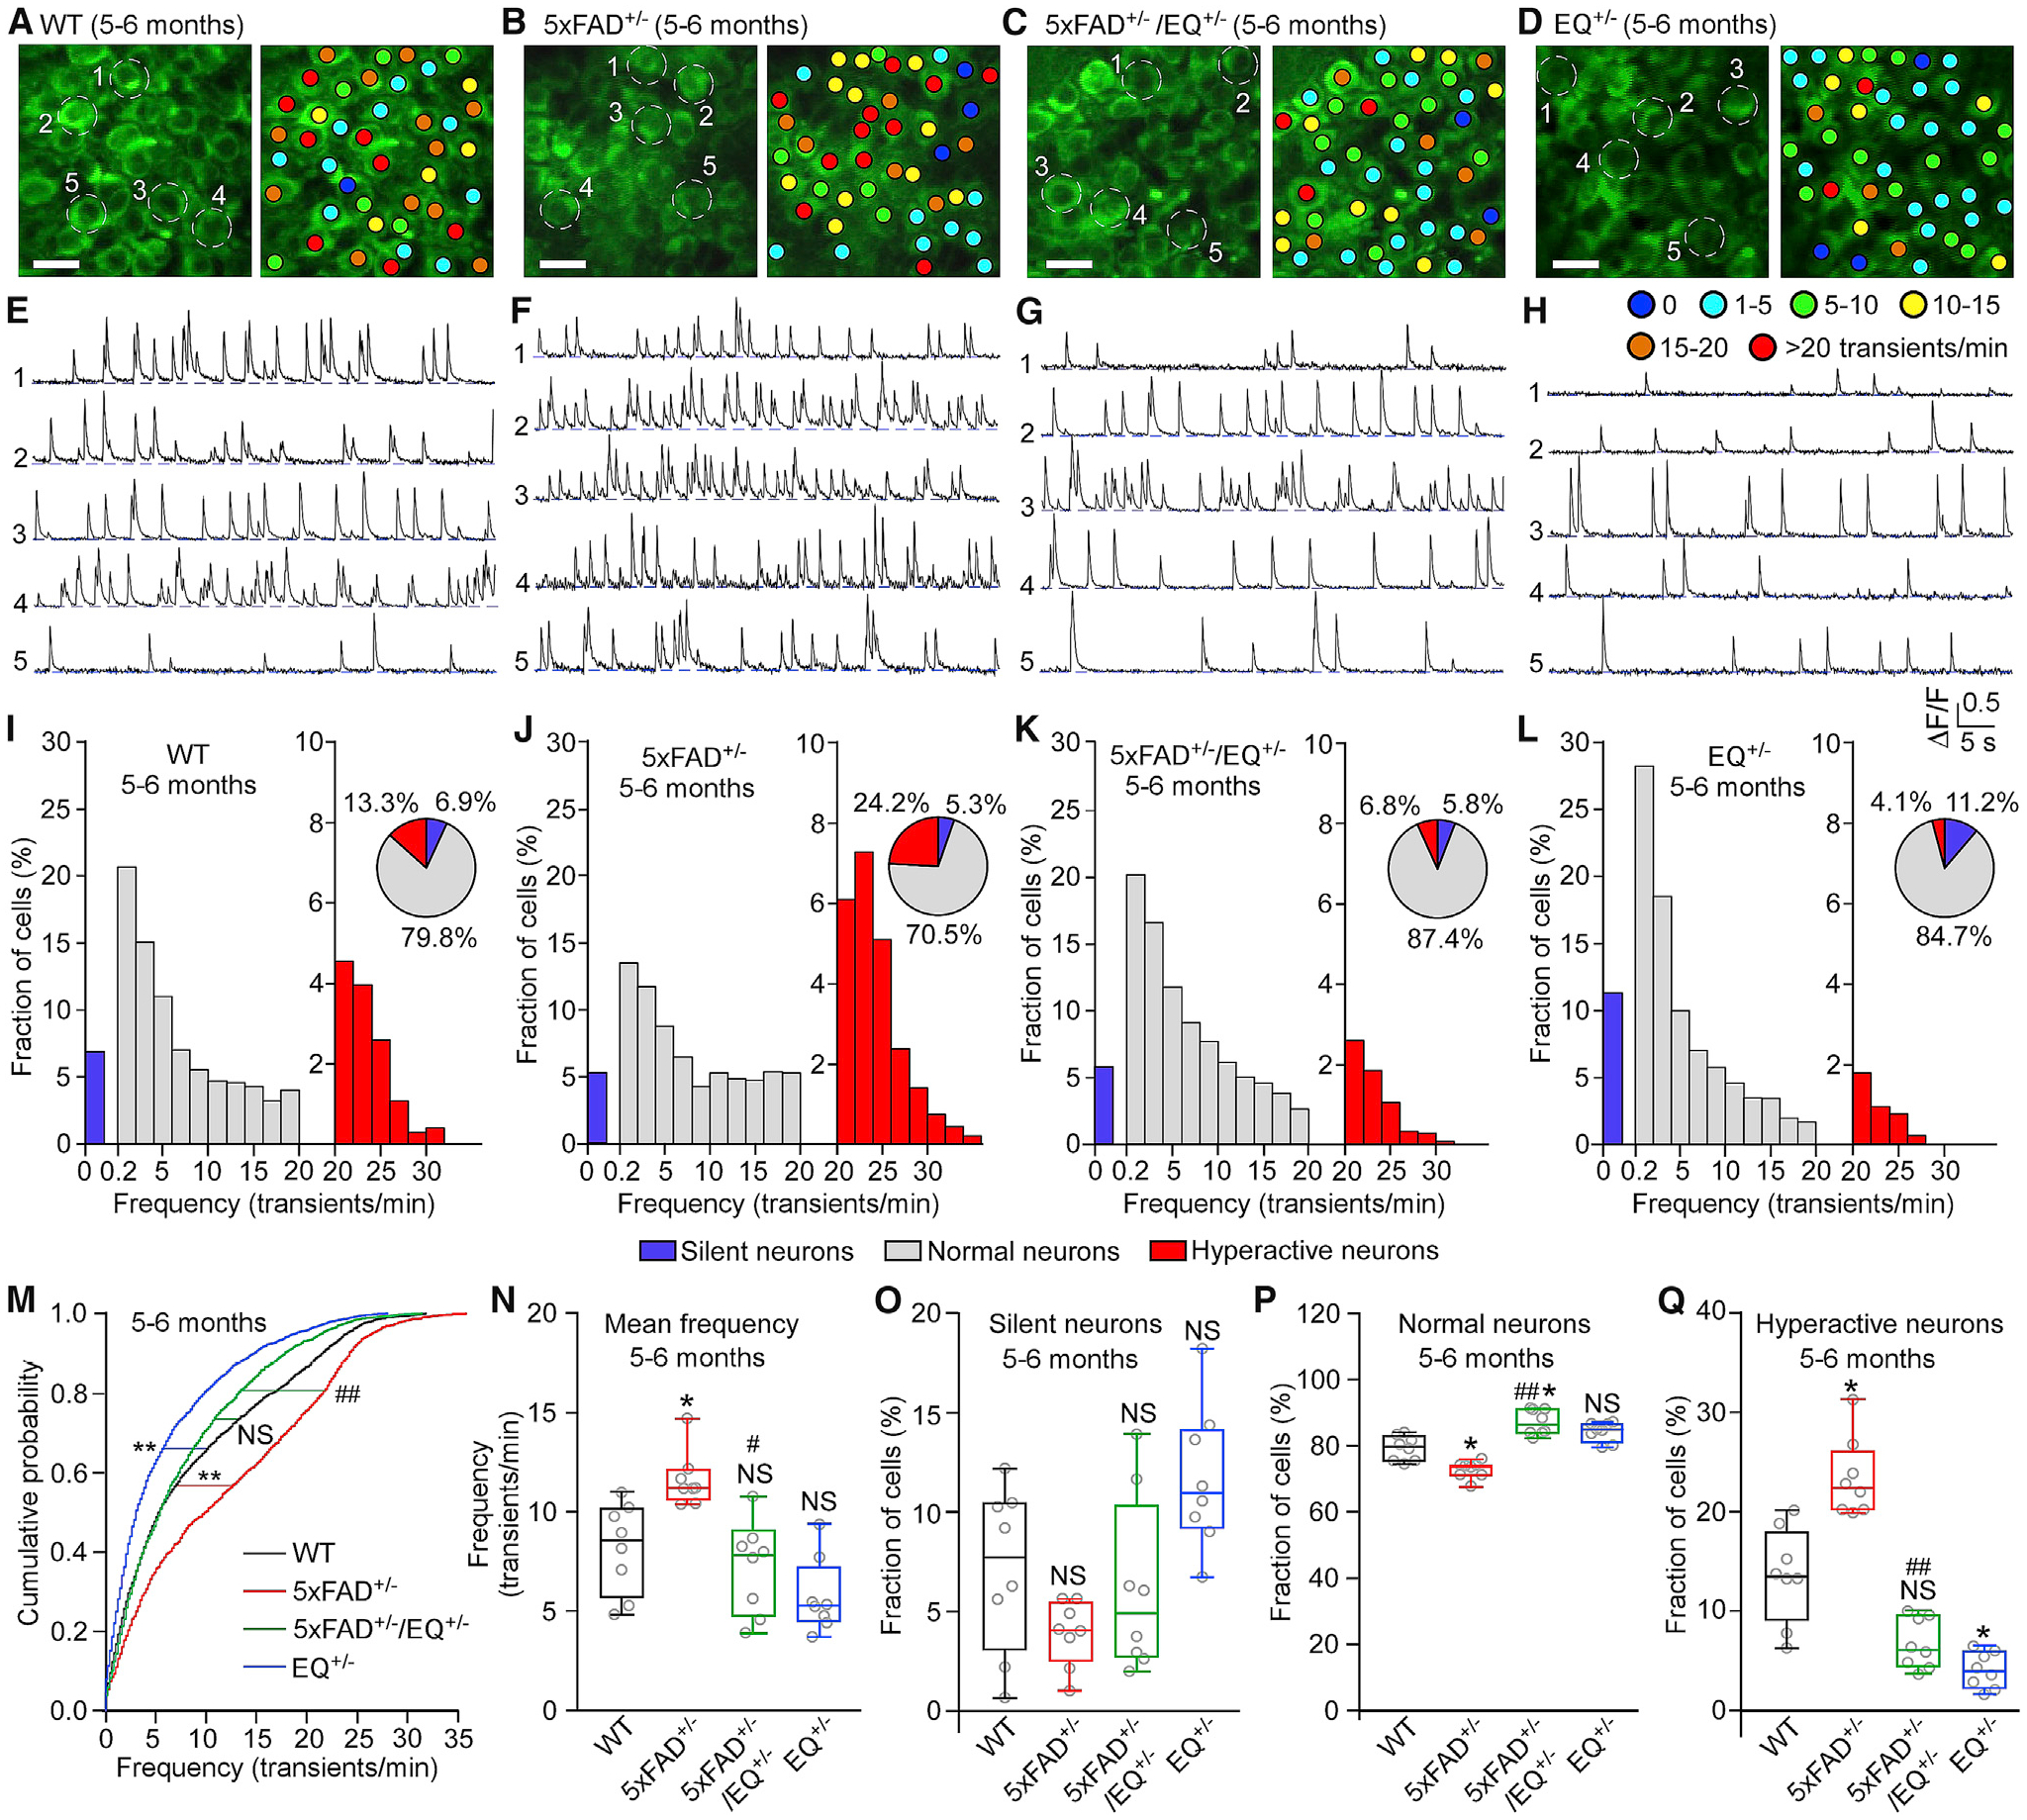
(A–D) Two-photon Ca2+ images of the hippocampal CA1 region of 5- to 6-month-old WT (A), 5xFAD+/− (B), 5xFAD+/−/EQ+/− (C), and EQ+/− (D) mice in vivo. Colored dots indicate the number of Ca2+ transients per minute.
(E–H) Ca2+ traces of the five neurons circled in (A)–(D), respectively.
(I–L) Histograms showing the frequency distribution of Ca2+ transients in (I) WT (8 mice, 2,375 cells), (J) 5xFAD+/− (8 mice, 1,708 cells), (K) 5xFAD+/−/EQ+/− (8 mice, 2,283 cells), and (L) EQ+/− (8 mice, 2,392 cells). Pie charts show the relative proportions of silent, normal, and hyperactive neurons as defined previously (Busche, 2018; Busche et al., 2008, 2012).
(M) Cumulative probability functions showing frequency distributions of spontaneous Ca2+ transients in the CA1 region of WT (black), 5xFAD+/− (red), 5xFAD+/−/EQ+/− (green), and EQ+/− (blue) mice (Kruskal-Wallis test with Dunn’s multiple comparisons test).
(N) Mean Ca2+ transient frequency in the WT, 5xFAD+/−, 5xFAD+/−/EQ+/−, and EQ+/− CA1 region.
(O–Q) Percentage of silent (O), normal (P), and hyperactive (Q) cells in the WT, 5xFAD+/−, 5xFAD+/−/EQ+/−, and EQ+/− CA1 region.
Scale bars: 10 μm. Data shown are the median and range (Kruskal-Wallis test with Dunn-Bonferroni post hoc test; *p < 0.5, **p < 0.01 versus WT, #p < 0.05, ##p < 0.01; 5xFAD+/−/EQ+/− versus 5xFAD+/−). See also Figures S2 and S3.