
Figure 4. R-carvedilol Prevents and Rescues Neuronal Hyperactivity of 5xFAD+/− Hippocampal CA1 Neurons In Vivo.
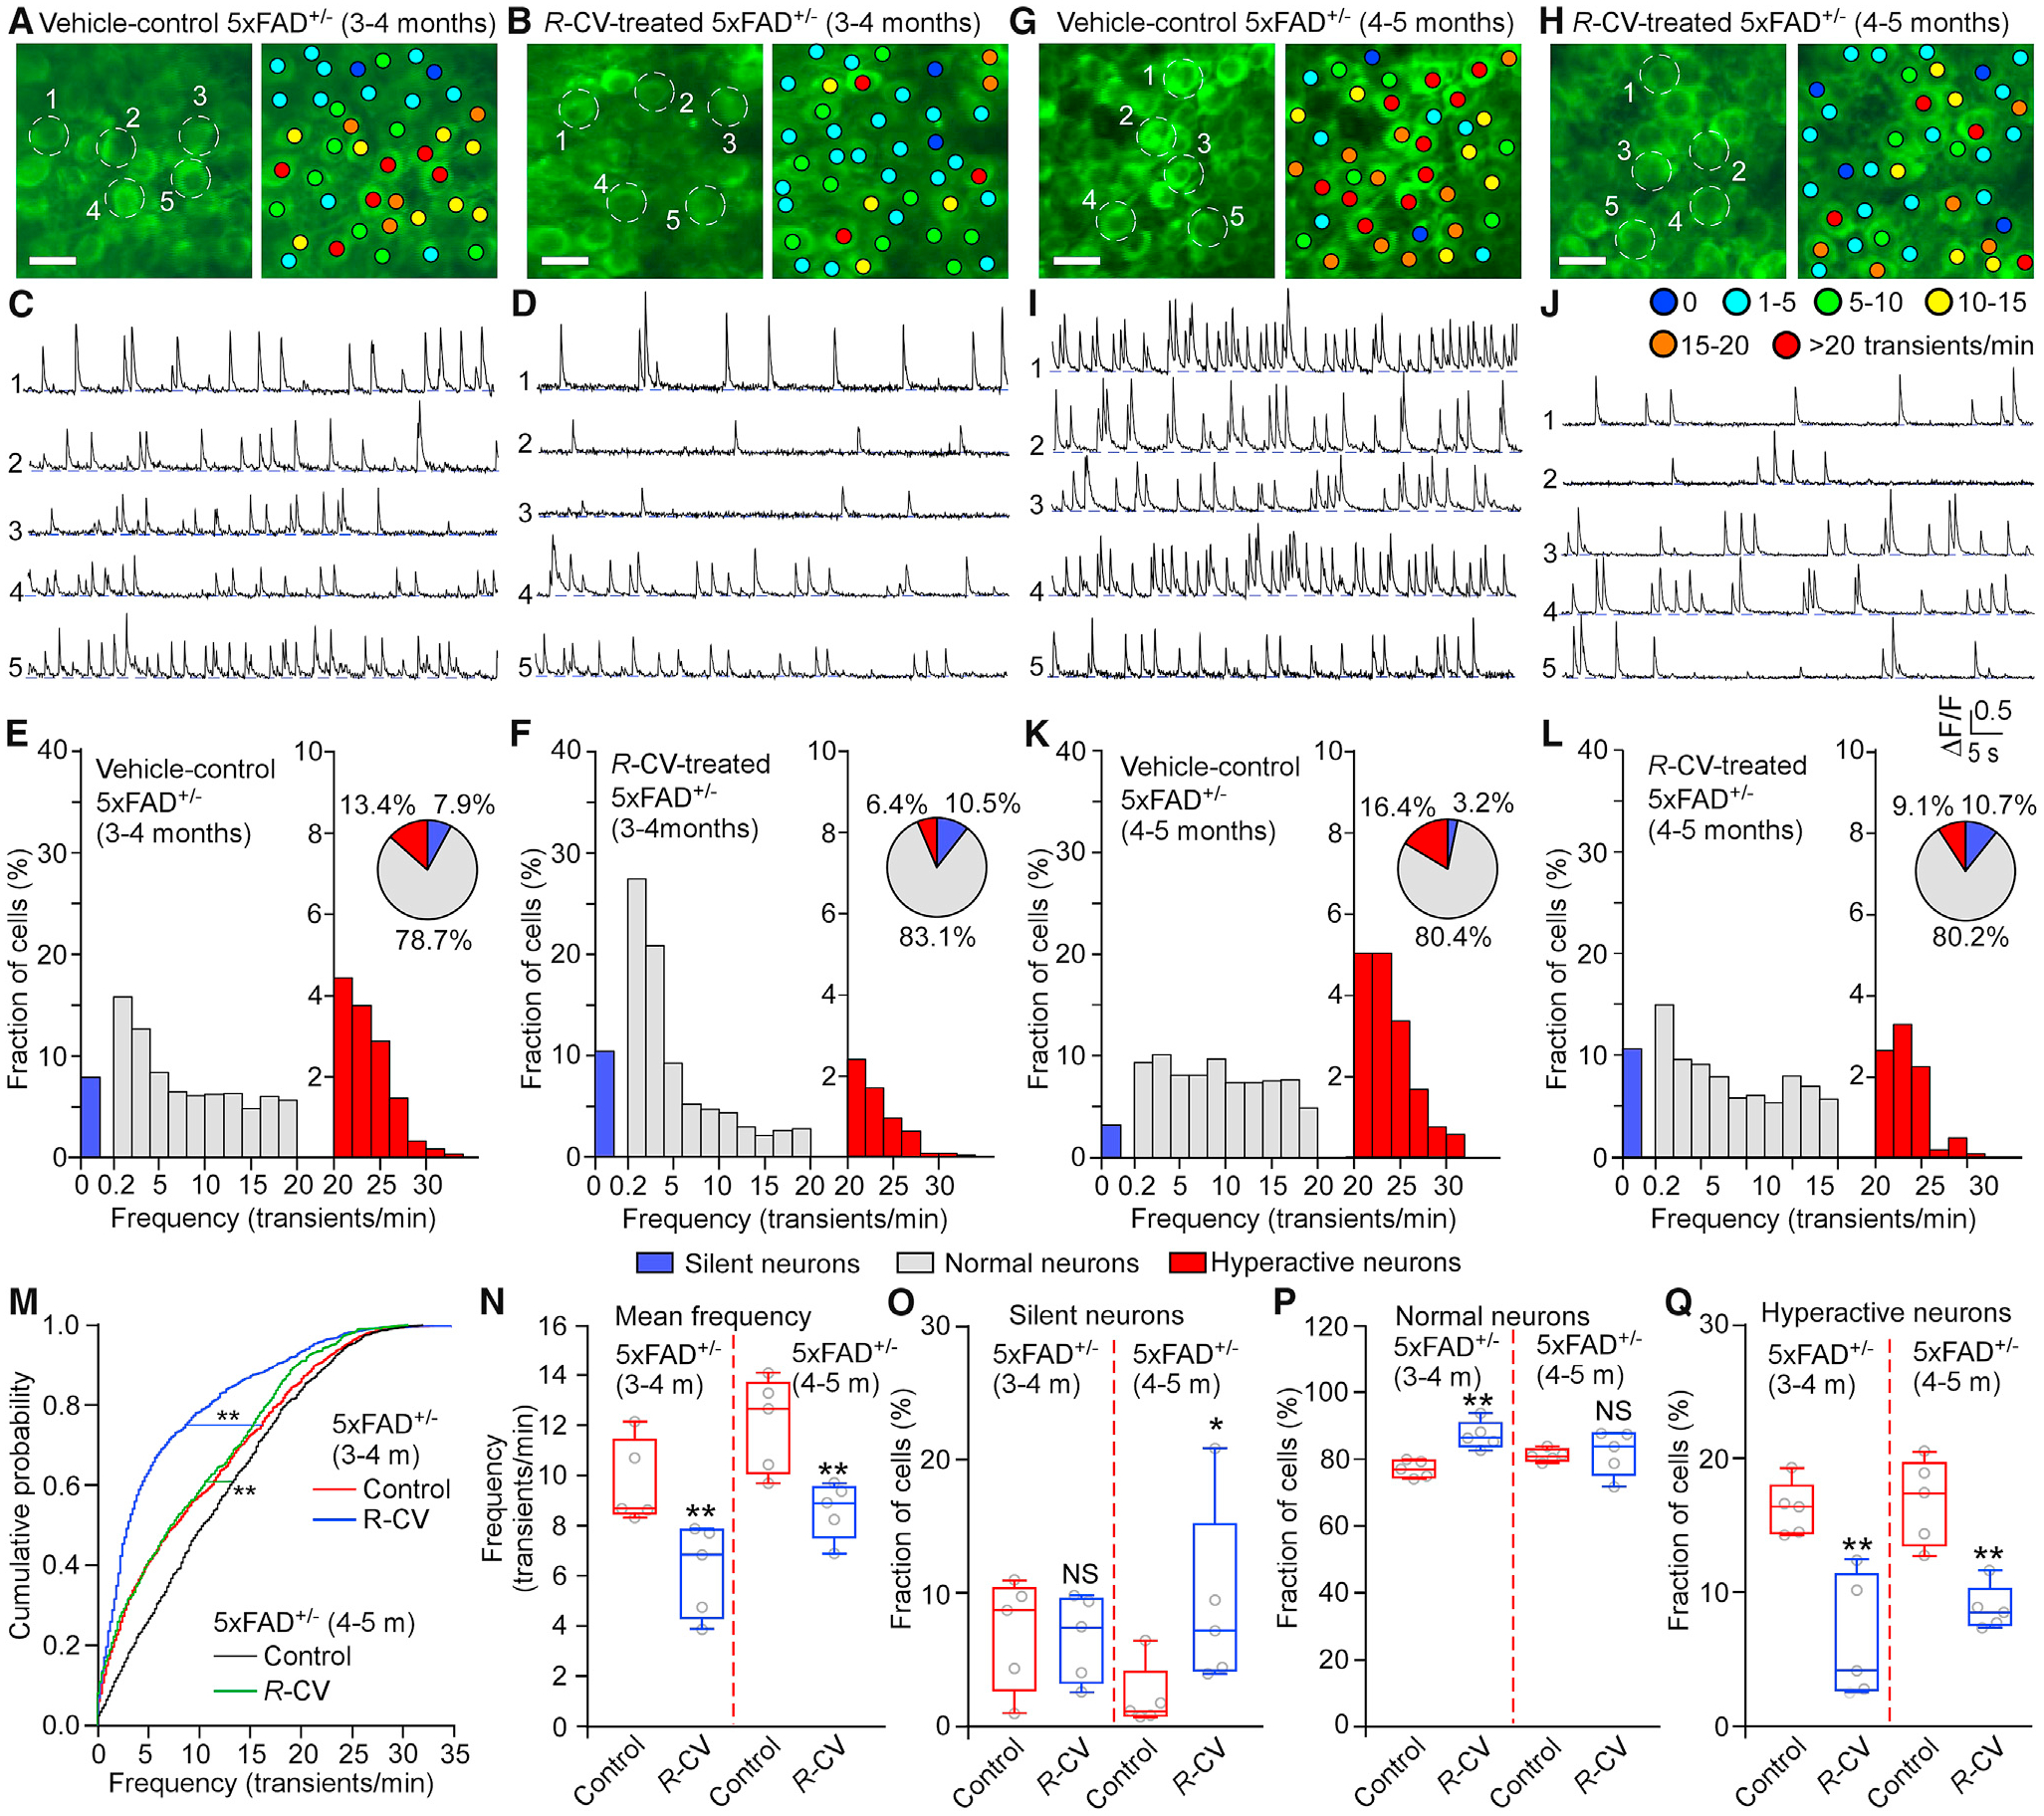
(A, B, G, and H) Two-photon in vivo Ca2+ imaging of the hippocampal CA1 region of 3- to 4-month-old (A and B) or 4- to 5-month-old (G and H) 5xFAD+/− mice treated with vehicle control (DMSO; A and G) or R-carvedilol (R-CV; 3.2 mg/kg/day; B and H). Colored dots indicate the number of Ca2+ transients per minute.
(C, D, I, and J) Ca2+ traces of the five neurons circled in (A), (B), (G), and (H), respectively.
(E, F, K, and L) Histograms showing the frequency distribution of Ca2+ transients in DMSO-treated mice (E and K, 5 mice, 1,066 cells and 5 mice, 897 cells, respectively) and R-CV-treated mice (F and L; 5 mice, 1,181 cells and 5 mice, 757 cells, respectively). Pie charts show the relative proportions of silent, normal, and hyperactive neurons.
(M) Cumulative probability functions showing frequency distributions of spontaneous Ca2+ transients in the CA1 region of 3- to 4-month-old 5xFAD+/− mice treated with DMSO (red) or R-CV (blue) and 5- to 6-month-old 5xFAD+/− mice treated with DMSO (black) or R-CV (green) (Kruskal-Wallis test with Dunn’s multiple comparisons test).
(N) Mean Ca2+ transient frequency in the CA1 region of 3- to 4-month-old and 4- to 5-month-old 5xFAD+/− mice treated with DMSO or R-CV.
(O–Q) Percentage of silent (O), normal (P), and hyperactive (Q) cells in the CA1 region of 3- to 4- and 4- to 5-month-old 5xFAD+/− mice treated with DMSO or R-CV. Scale bars, 10 μm. Data shown are the median and range (Kolmogorov-Smirnov test with Dunn-Bonferroni post hoc test and Mann-Whitney U test; **p < 0.01 versus control).