
Figure 6. E4872Q+/− Has No Significant Effects on Aβ Accumulation but Protects against Neuron Loss in 5xFAD+/− Mice.
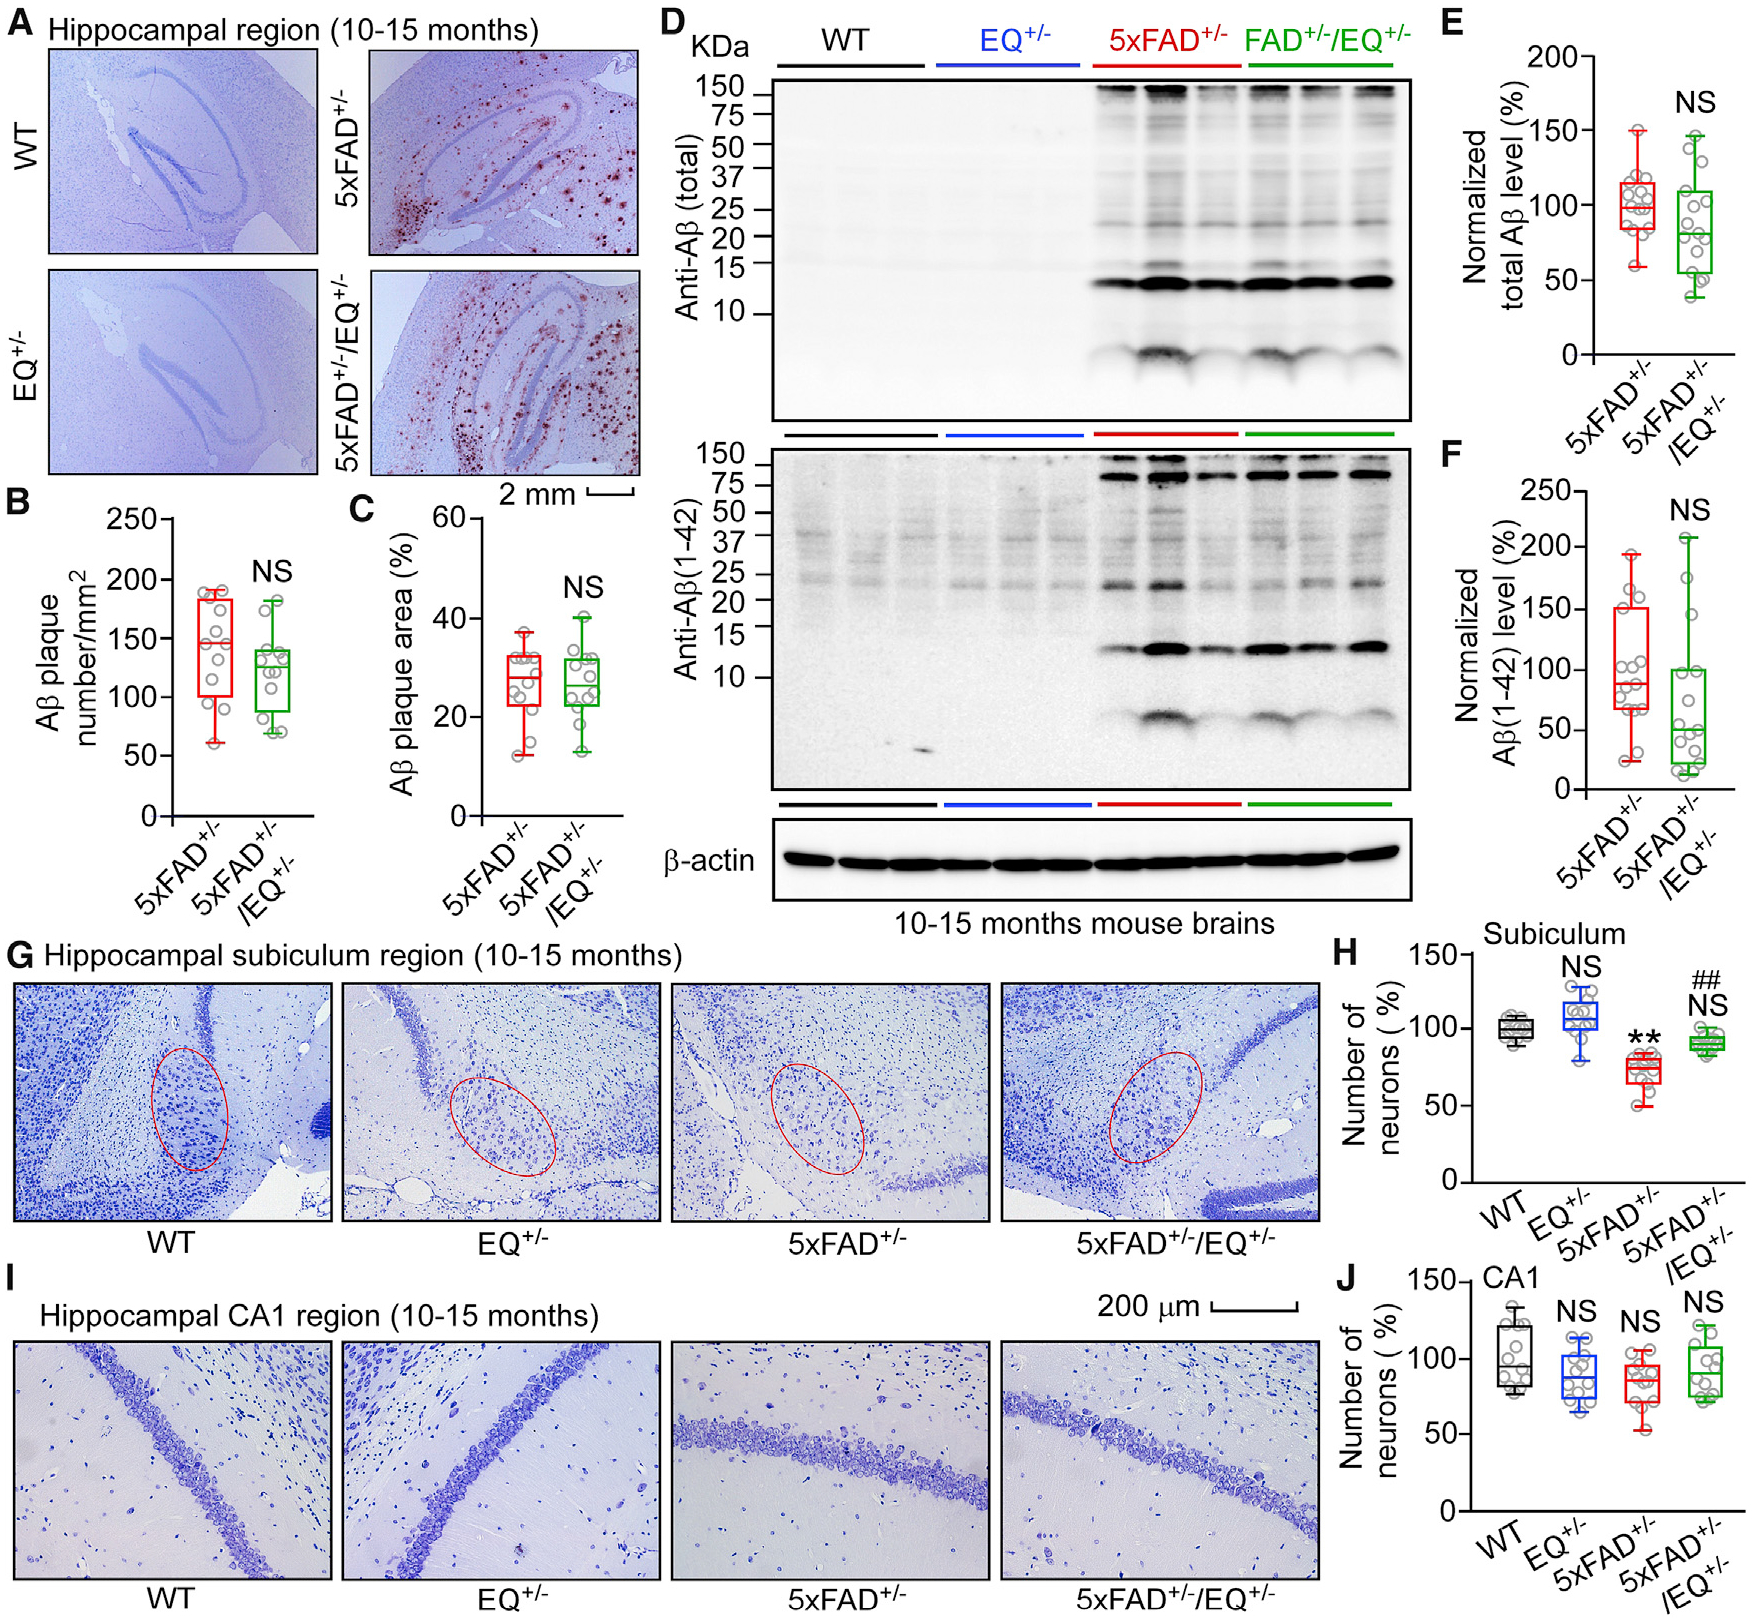
(A) Aβ deposition in the hippocampal region of 10- to 15-month-old WT, EQ+/−, 5xFAD+/−, and 5xFAD+/−/EQ+/− mice.
(B) Averaged Aβ plaque numbers in the hippocampal region of 10- to 15-month-old 5xFAD+/− (12 mice, 36 slices) and 5xFAD+/−/EQ+/− (12 mice, 36 slices) mice.
(C) Percentage of the hippocampal area showing positive Aβ staining.
(D) Immunoblot analysis of brain homogenates from 10- to 15-month-old WT, EQ+/−, 5xFAD+/−, and 5xFAD+/−/EQ+/− mice.
(E and F) Normalized total Aβ levels (E) and normalized Aβ (1–42) levels (F) in WT (n = 15), EQ+/− (n = 11), 5xFAD+/− (n = 21), and 5xFAD+/−/EQ+/− (n = 20) brains.
(G) Images of Nissl staining of 10- to 15-month-old WT, EQ+/−, 5xFAD+/− and 5xFAD+/−/EQ+/− mouse brain sections.
(H) Numbers of pyramidal neurons in the subiculum region (red oval) of WT (12 mice, 36 slices), EQ+/− (12 mice, 36 slices), 5xFAD+/− (12 mice, 36 slices), and 5xFAD+/−/EQ+/− (12 mice, 36 slices) mice.
(I) Images of Nissl staining of 10- to 15-month-old WT, EQ+/−, 5xFAD+/−, and 5xFAD+/−/EQ+/− mouse brain sections.
(J) Numbers of pyramidal neurons in the CA1 region of WT (12 mice, 36 slices), EQ+/− (12 mice, 36 slices), 5xFAD+/− (12 mice, 36 slices), and 5xFAD+/−/EQ+/− (12 mice, 36 slices) mice.
Scale bars, 2 mm in (A) and 200 μm in (G) and (I). Data shown are the median and range (Mann-Whitney U test and Kruskal-Wallis test with Dunn-Bonferroni post hoc test; **p < 0.01 versus WT, ##p < 0.01; 5xFAD+/−/EQ+/− versus 5xFAD+/−). See also Figure S7.