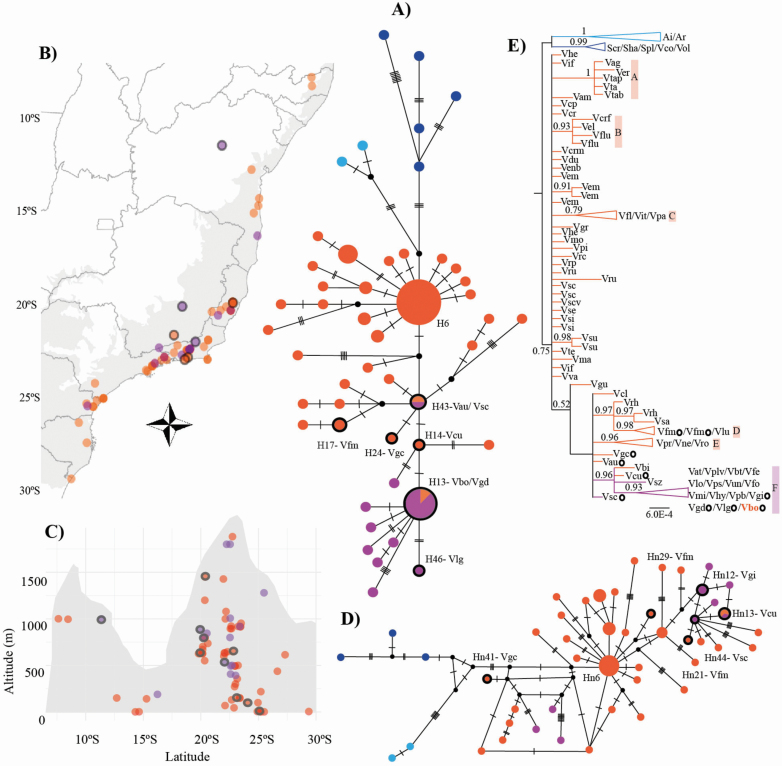
Figure 3.
Results based on the cpDNA (matK and rps16-trnK) and PHYC data set for 83 taxa, including 76 Vriesea accessions. Coloured symbols represent hummingbird (orange) and bat (purple) syndromes in Vriesea. Blue symbols represent the outgroup genera Alcantarea and Stigmatodon. Vriesea species with floral morphology distinct from the typical hummingbird- and bat-pollinated flowers (mixed floral traits) are circled in black. (A) Chloroplast median-joining network showing genetic divergence among pollination groups. Each circle represents a haplotype with the size proportional to its total frequency. We indicate codes for haplotypes of intermediate species and the most frequent H6 and Hn6 (Table 1). Mutational steps are indicated with dashes and hypothetic haplotypes with black dots. (B) Map of Vriesea species sampling distribution along the Brazilian Atlantic Forest in grey and (C) across altitude. The mountain profile is illustrative. (D) PHYC median-joining network. (E) Chloroplast Bayesian phylogeny with posterior probabilities above 0.50 shown.

