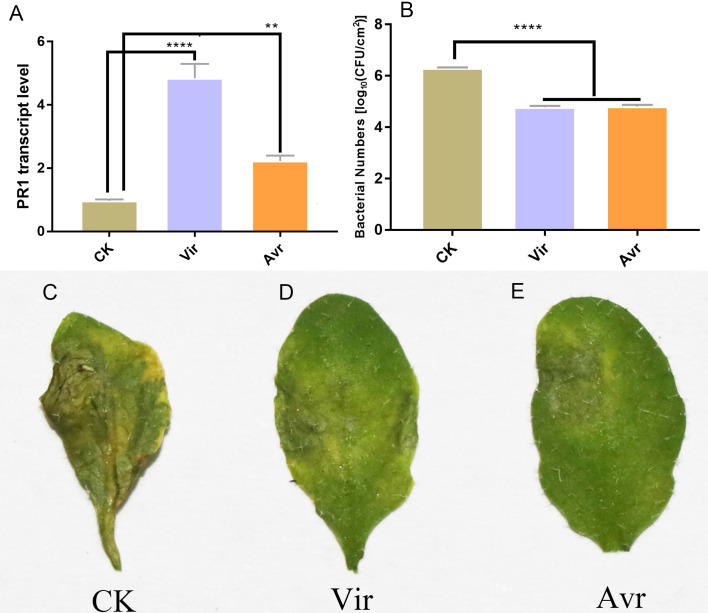
Figure 1. Sample evaluation of different treated groups.
Arabidopsis Col-0 plants were inoculated with avirulent Psm avrRpm1 (Avr), virulent Psm ES4326 (Vir) and MgCl2 (CK). RT-qPCR and bacterial growth data represent an average of three biological replicates, One-way ANOVA was used to determine significant differences. (A) Expression analysis of PR1 gene in distal leaves (DL) of plants locally Vir and Avr inoculated. One-way ANOVA was used to determine significant differences. (B) Assessment of the bacterial growth in DL after secondary infection with Vir, when LL was infected with Avr, Vir and CK at first. ** represented P < 0.01, **** represented P < 0.0001. (C–E) Phenotype of DL after secondary infection. Local leaves was infected with Avr, Vir and CK at first, after 48 h, the DL was infected with Vir. The phenotype of DL was observed 72 h later.

