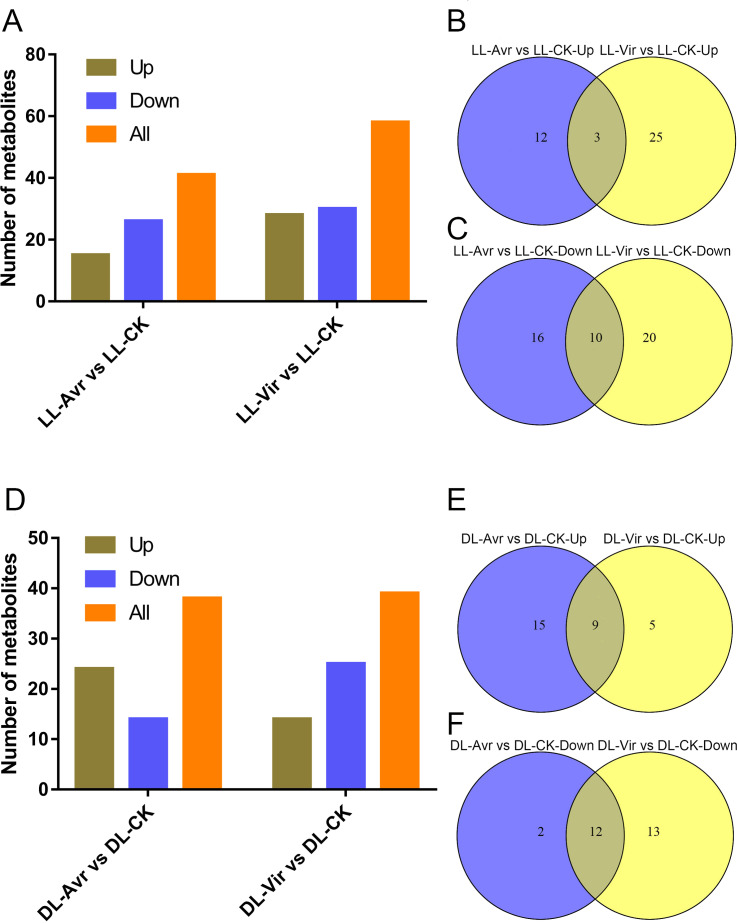
Figure 4. Summary of Arabidopsis metabolites response to the infection of Avr and Vir in LL and DL of locally Avr and Vir inoculated plants.
(A) Number of up- or down-regulated metabolites in LL-Avr vs. LL-CK and LL-Vir vs. LL-CK. (B) Venn diagram representing up regulated metabolites in LL-Avr vs. LL-CK and LL-Vir vs. LL-CK. (C) Venn diagram representing down-regulated metabolites in LL-Avr vs LL-CK and LL-Vir vs. LL-CK. (D) Number of up- or down-regulated metabolites in DL-Avr vs. DL-CK and DL-Vir vs. DL-CK. (E) Venn diagram representing up regulated metabolites in DL-Avr vs. DLCK and DL-Vir vs. DL-CK. (F) Venn diagram representing down-regulated metabolites in DL-Avr vs. DLCK and DL-Vir vs. DL-CK.

