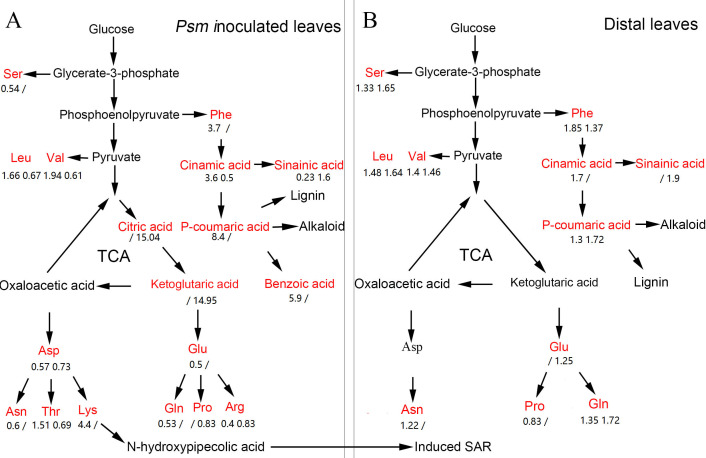
Figure 6. The pathway map involved in DAMs associated with phenolic compounds, amino acids, and organic acids in Psm-inoculated local leaves (A) and distal leaves of plants locally Psm-inoculated (B).
Red represents differentially accumulated metabolites. Numbers represent fold change of metabolites in LL-Vir vs. LL-CK and LL-Avr vs. LL-CK, or in DL-Vir vs. DL-CK and DL-Avr vs. DL-CK, respectively. A ‘/’ represented that this metabolite was not detected.

