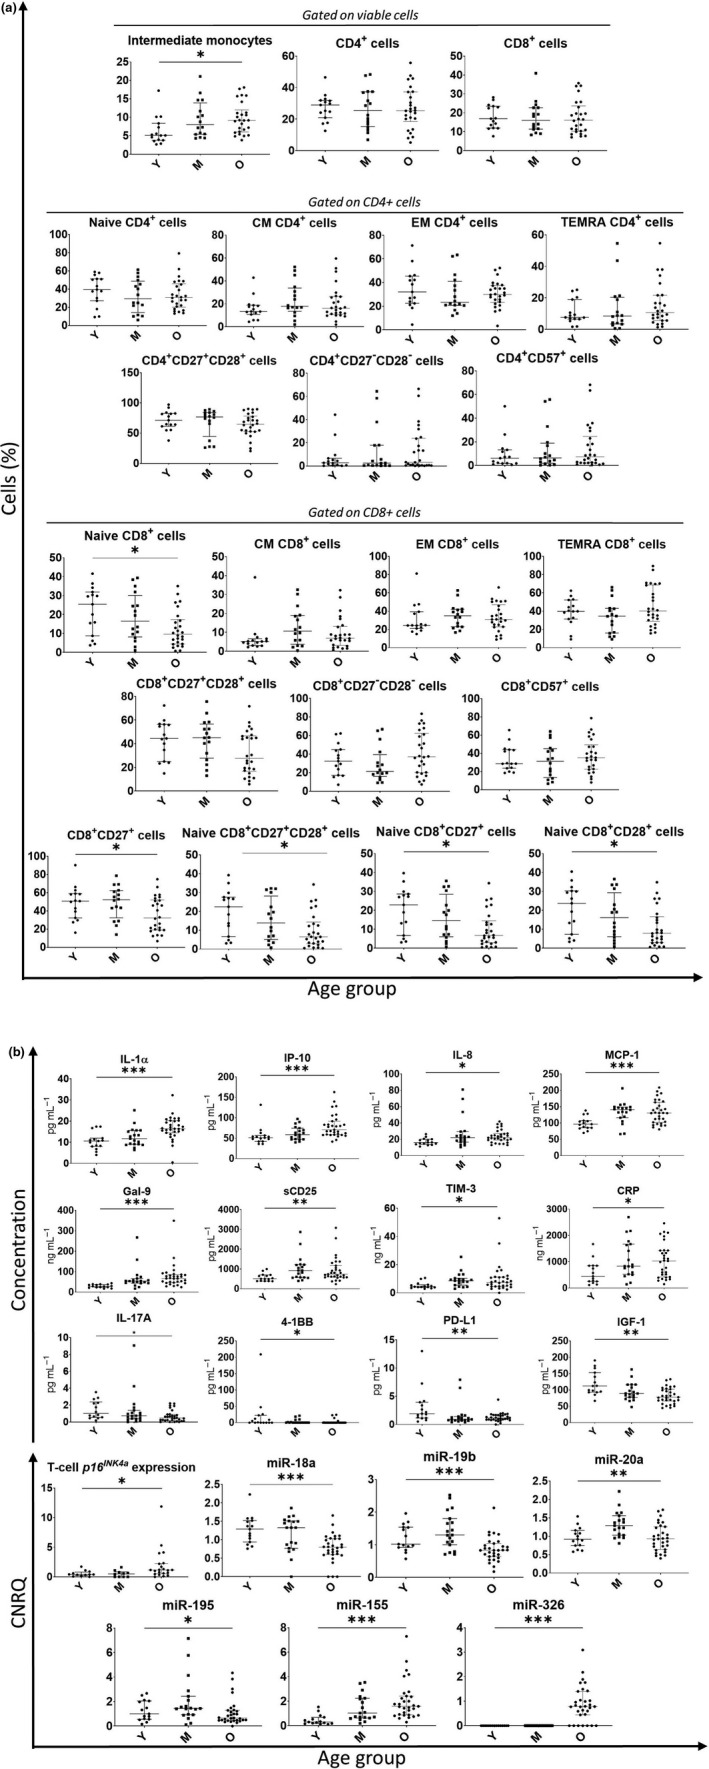
Figure 1.

(a) PBMC subsets with significant age‐related variations are shown, as well as the important CD4 and CD8 T‐cell subpopulations (Naive, CM, EM, TEMRA) together with CD27/CD28 and CD57 expression on CD4+ and CD8+ T cells. (b) Blood immune/senescence plasma markers that showed significant difference between the three different age categories. Plasma markers measured via multiplex cytometric bead array technology (plasma cytokines, chemokines and immune checkpoint markers) or ELISA (IGF‐1) were run in duplicate. T‐cell p16INK4a and miRs expression were measured via RT‐PCR in triplicate. The 35–45 years category (N = 15) is represented with Y, the 55–65 years category (N = 19) is represented with M, and the ≥ 70 years (N = 31) category is represented with O. The median and IQR are shown in grey. The level of significance is represented with an *, with *: P ≤ 0.05; **: P ≤ 0.01 and ***: P ≤ 0.001. The P‐values were calculated via the Kruskal–Wallis test.
