Figure 2.

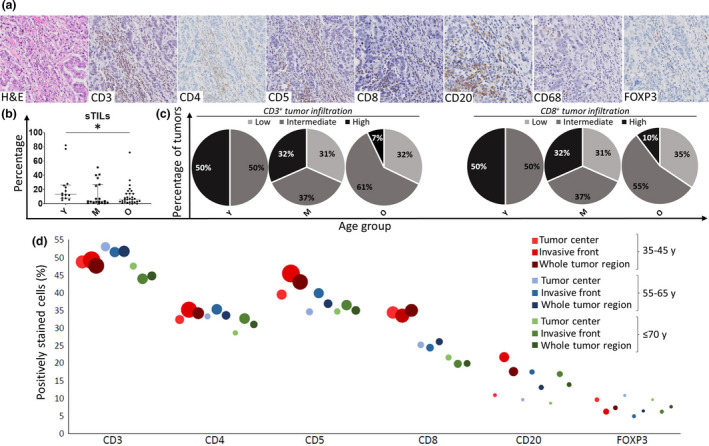
(a) Representative microphotographs of the 7 immunostainings: H&E, CD3, CD4, CD5, CD8, CD20, CD68 and FOXP3. The microphotographs were collected from the same tumor sample, which had 27.0% sTILs. (b) Stromal tumor‐infiltrating lymphocytes (sTILs) % shows a significant difference (P = 0.025) between the three different age categories: the 35–45 years ‘young’ (Y) category (N = 14), the 55–65 years ‘middle’ (M) category (N = 19) and the ≥ 70 years ‘old’ (O) category (N = 29). The median and IQR are shown. (c) The percentage of tumors with a low, intermediate or high CD3 and CD8 infiltration in the different age groups. The cut‐offs were based on the IQR of the density of CD3+ and CD8+ cells in the whole cohort. Low infiltration: minimum – lower quartile (lowest 25%), intermediate infiltration: lower quartile – upper quartile and high infiltration: upper quartile – maximum (highest 25%). (d) Tumor immune infiltration in the different tumor regions for the different age categories. The different immune cell markers (CD3, CD4, CD5, CD8, CD20 and FOXP3) are denoted on the x‐axis. Positively stained immune cells (%) can be found on the y‐axis. The area of the bubbles represents the density (absolute number per mm2) of the marker in that specific region. The 35–45 years age category is represented in red, the 55–65 years category in blue and the ≥ 70 years category in green. The tumor centre, invasive front and the whole tumor region are represented by increasing colour intensities. P‐values were calculated via the Kruskal–Wallis test.
