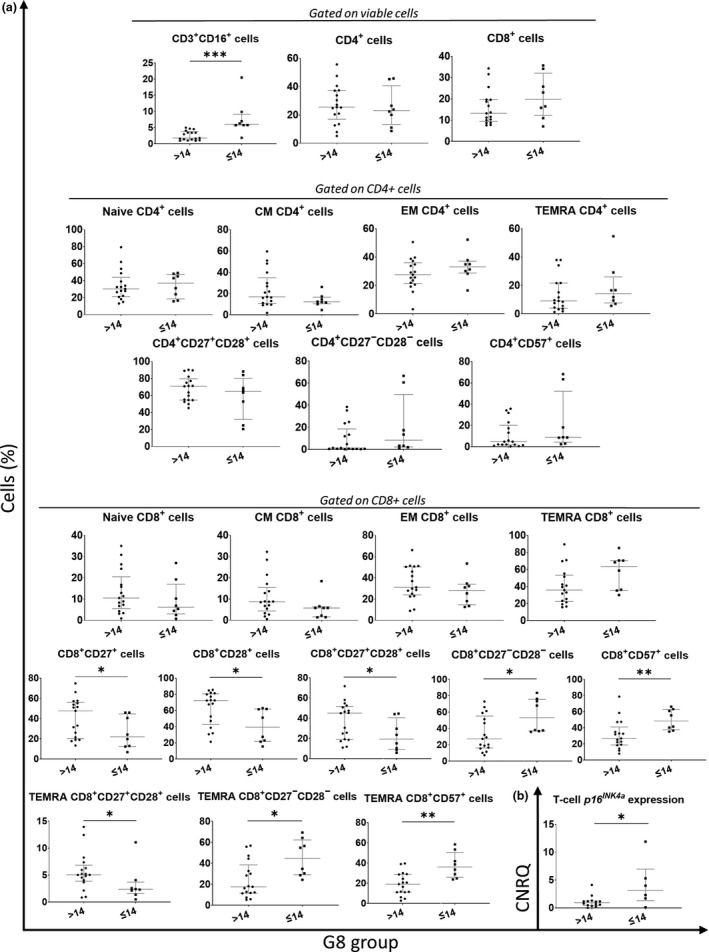
Figure 3.

(a) PBMC subsets with significant variations between the G8 groups [G8 > 14: ‘fit’ (N = 19) and G8 ≤ 14: ‘frail’ (N = 10)] are shown, and biologically relevant CD4 and CD8 T‐cell subpopulations (Naive, CM, EM, TEMRA) together with CD27/CD28 and CD57 expression on CD4+ and CD8+ T‐cells. (b) T‐cell p16INK4a expression, showing significant difference between the two G8 groups. Plasma markers measured via multiplex cytometric bead array technology (plasma cytokines, chemokines and immune checkpoint markers) or ELISA (IGF‐1) were run in duplicate. T‐cell p16INK4a and miRNA expression were measured via RT‐PCR in triplicate. The median and IQR are shown in grey. Levels of significance: *: P ≤ 0.05; **: P ≤ 0.01 and ***: P ≤ 0.001. The P‐values were calculated via the Mann–Whitney U test.
