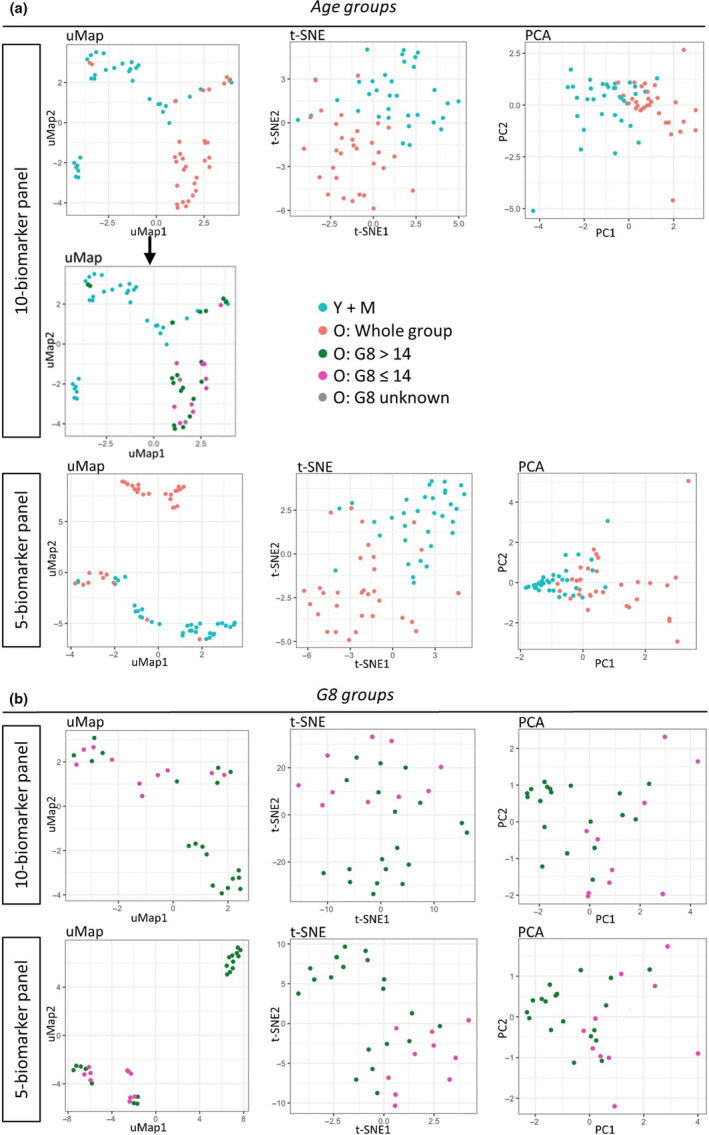
Figure 5.

Dimensionality reduction plots. (a) A panel of 10 and 5 biomarkers was assembled to classify the patients in the old group (N = 31) or the younger age groups (N = 34). The 10 and 5 biomarkers were selected based on their statistical performance and biological relevance. uMap, t‐SNE and PCA projections are shown, with the younger age groups in blue (Y + M), the whole old group in red. The uMap projection of the 10‐biomarker age panel shows a distinct cluster of older patients. This cluster was studied in more detail in the plot below, showing ‘frail’ older patients (G8 ≤ 14) are shown in pink, ‘fit’ older patients (G8 > 14) in green and older patients with an unknown G8‐score in grey. (b) Another panel of 10 or 5 biomarkers was assembled to classify the patients in the ‘fit’ G8 > 14 group (N = 19) or the ‘frail’ G8 ≤ 14 group (N = 10). Again, the 10 or 5 biomarkers were selected based on their statistical performance and biological relevance. On the uMap, t‐SNE and PCA projections the ‘fit’ patients (G8 > 14) are shown in green and the ‘frail’ patients (G8 ≤ 14) in pink.
