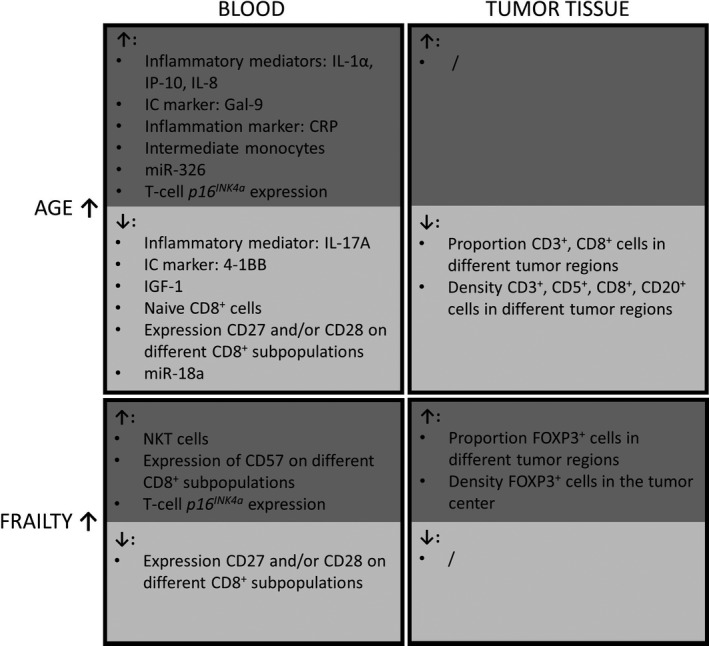
Figure 6.

An overview of increases (↑) and decreases (↓) of the blood immune/senescence markers and the tumor immune infiltrate markers according to age and increasing frailty level. Notably, for some markers (not shown in this figure), the highest levels were present in the middle age category (e.g. blood levels of MCP‐1, sCD25, TIM‐3, miR‐19b, miR‐20a, miR‐195), while for other markers, lowest levels were present in the middle age category (PD‐L1 in blood, and sTILs % in tumor). IC, Immune checkpoint.
