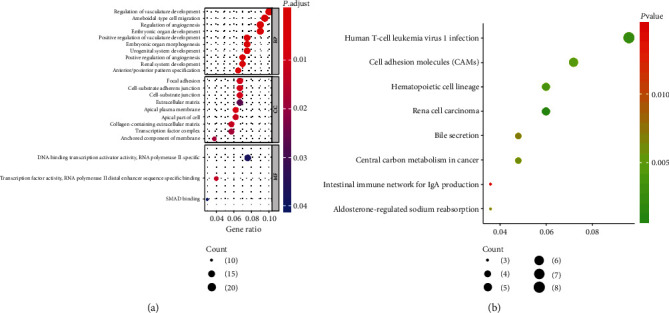
Figure 2.

Functional enrichment analysis of the UGs Hypo and DGs Hyper. (a) The most enriched GO terms for the UGs Hypo and DGs Hyper. (b) The most activated KEGG pathways for the UGs Hypo and DGs Hyper. The dot size represents the number of enriched genes, and the color of the dot represents P.adjust (red to green means the P.adjust from low to high).
