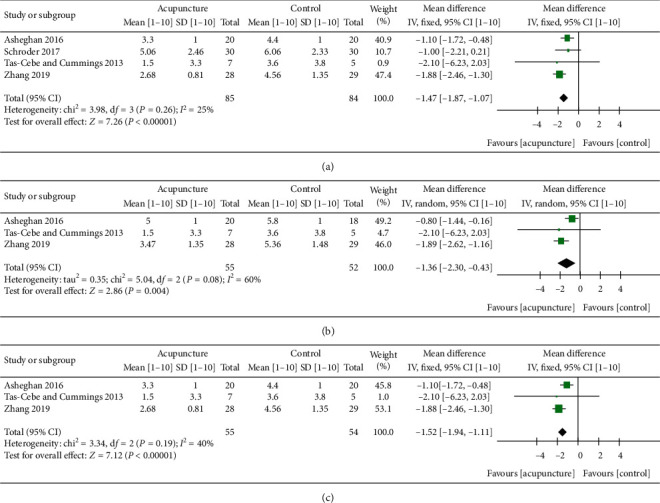
Figure 3.

Forest plot of VAS score of MA at different follow-up time course. (a) 0- to 12-week follow-up. Forest plot of comparison: acupuncture (MA + PT, MA + ESWT, press tack needles) versus control (PT + ESWT, PT exercise, press tack placebo). Follow-up time: [21] immediate effect, [23] 6 weeks, [19] 8 weeks, and [22] 12 weeks. (b) 4- to 6-week follow-up. Forest plot of comparison: acupuncture (MA + PT, MA + ESWT) versus control (PT + ESWT, PT exercise). Follow-up time: [19] 4 weeks, [23] 6 weeks, and [22] 6 weeks. (c) 1.5- to 3-month follow-up. Forest plot of comparison: acupuncture (MA + PT, MA + ESWT) versus control (PT + ESWT, PT exercise). Follow-up time: same as in (b). Outcome: VAS score [1–10]. ∗Schroder et al. 2017 CMS pain subscore 0–15 descending was converted to VAS 1–10 ascending by the following method: 1O − (M/1.5)=M(VAS), (SD/1.5)=SD(VAS).∗Sensitivity analysis of Figure 3(b) found that when excluding [19] from the analysis, heterogeneity: tau2 = 0.00; chi2 = 0.37, df = 1 (P=0.54); I2 = 0%, test for overall effect: Z = 2.59 (P=0.010).
