
Figure 1. mMED cryo-EM map and module organization.
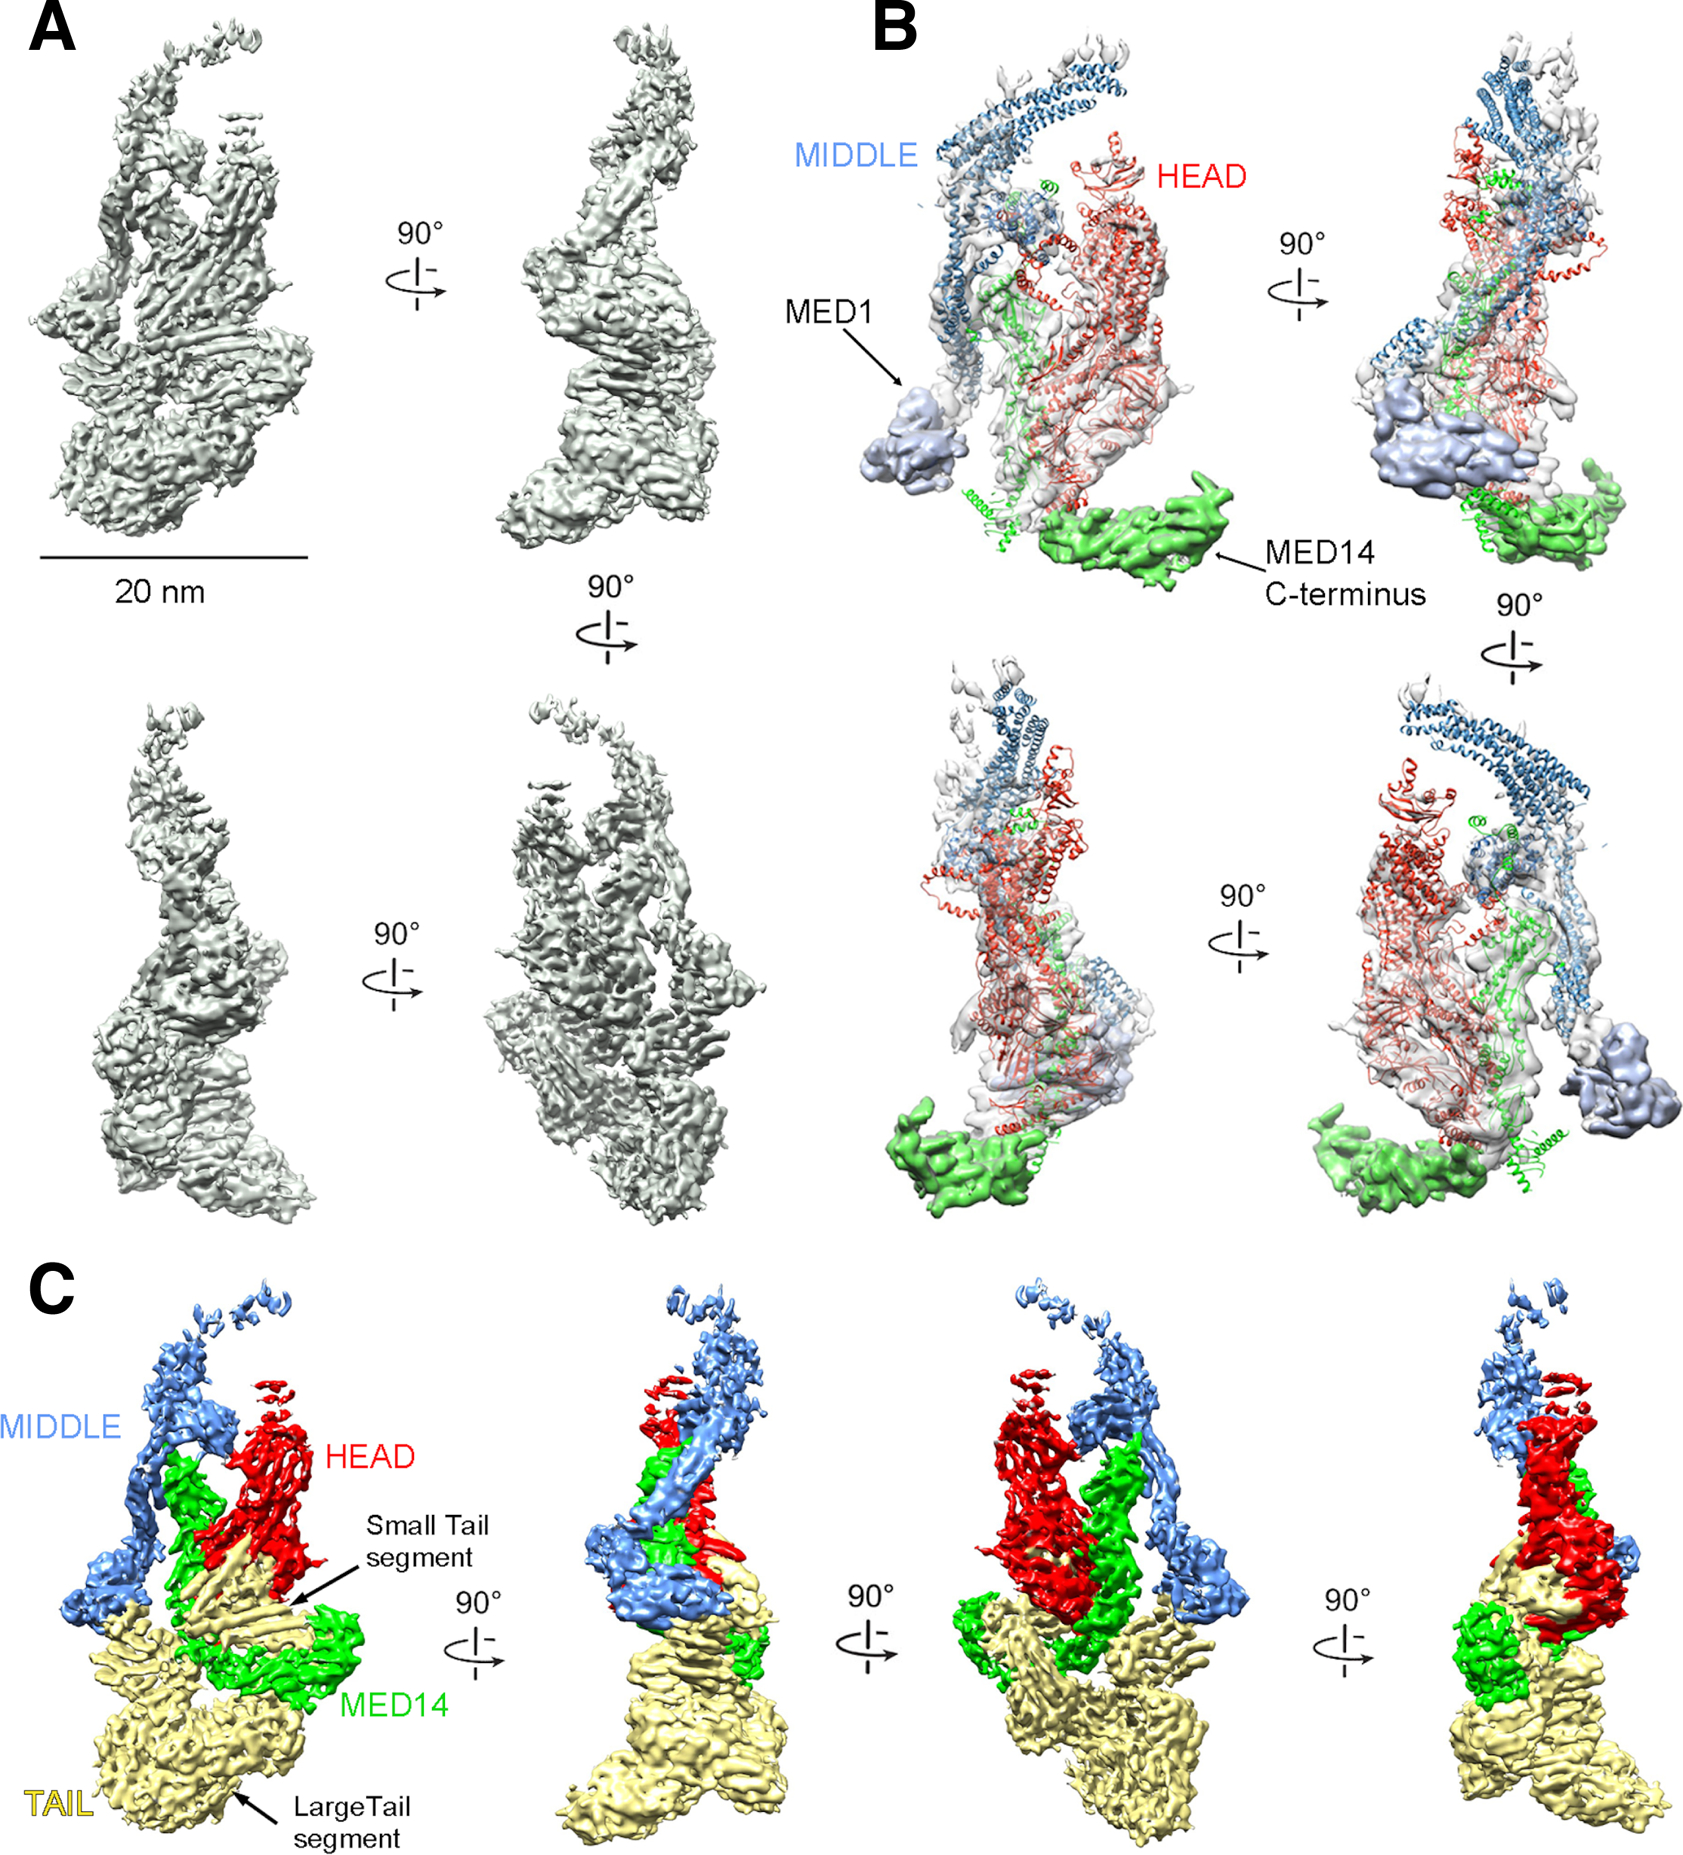
(A) mMED cryo-EM map at 5.9Å resolution. (B) Comparison between mMED core (transparent gray) and the atomic model of Sp Mediator core (Head in red; Middle in blue, Med14 in green). (C) Views of mMED cryo-EM map segmented by modules (Head, Middle and MED14 colored as in (B) and Tail in light yellow).