
Figure 3. mMED genetic and functional analysis.
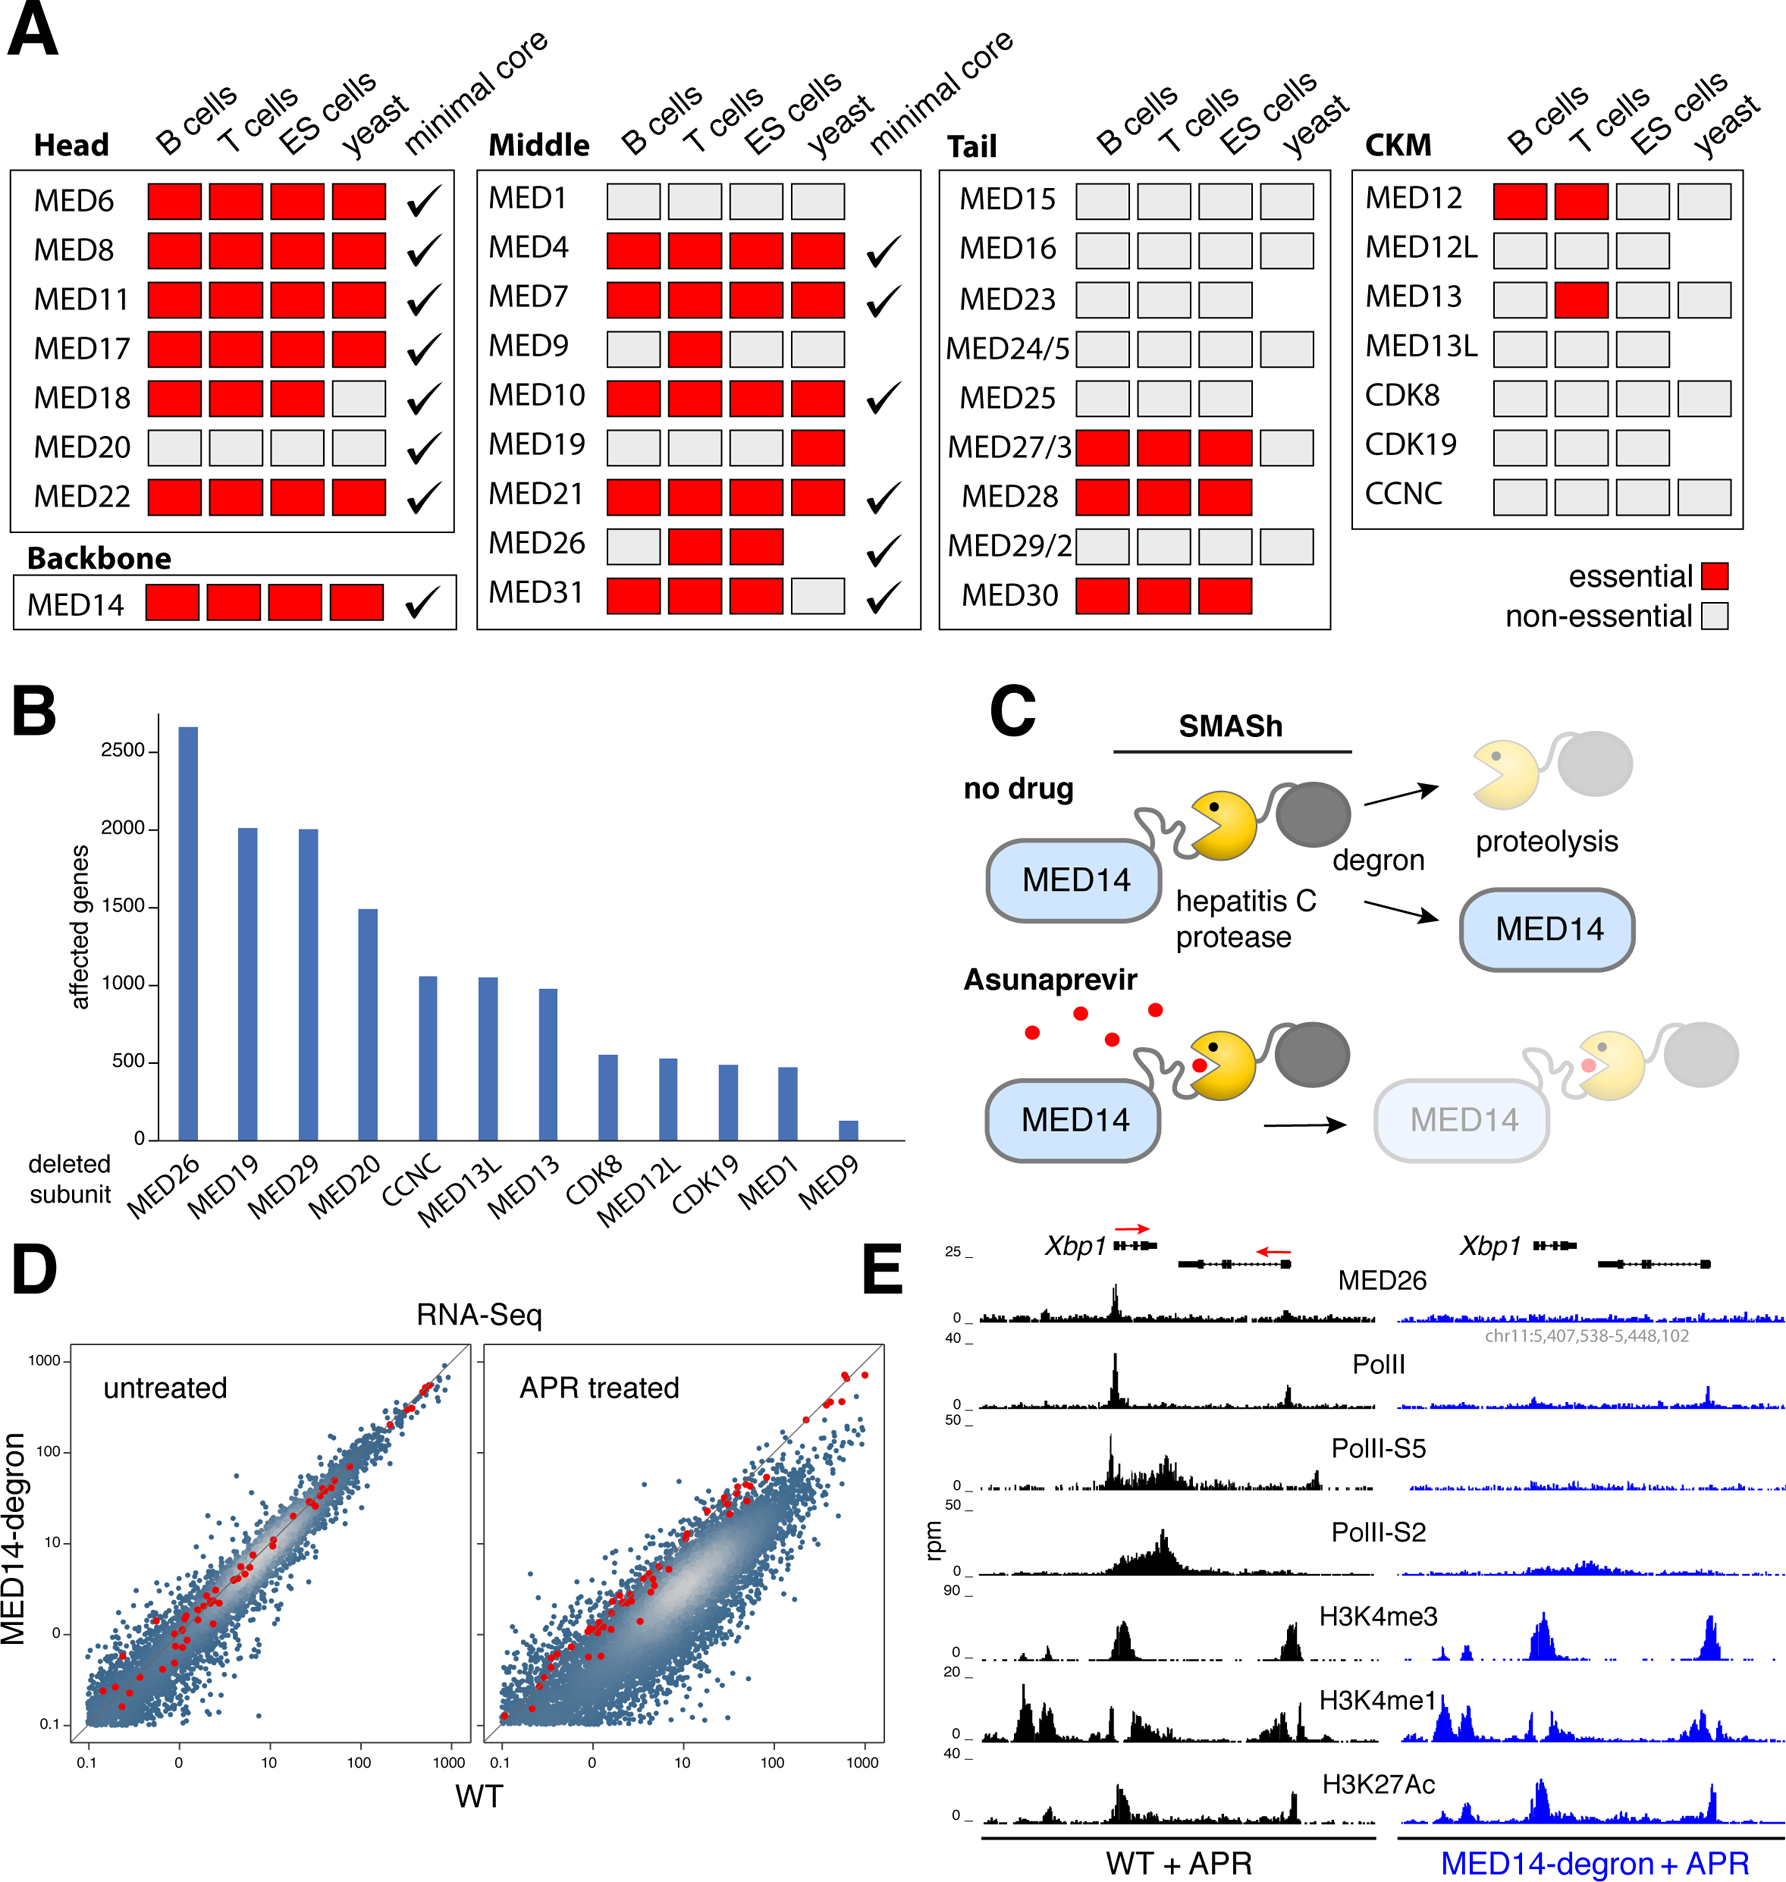
(A) Genetic screen from mouse T, B and ES cells compared to yeast and the hMED minimal core. Essential subunits denoted with red boxes, non-essential with grey ones, minimal core subunits with checkmarks. (B) Bar graph shows the number of transcriptionally affected genes (>1.5 fold) in CH12 B cells deficient for non-essential (non-tail) mMED subunits. (C) Schematic showing MED14-degron strategy. A SMASh tag consisting of a linker, the hepatitis C protease, and a degron subunit was fused to MED14-N terminus. In untreated cells, the protease frees MED14 from SMASh, which is degraded. The hepatitis C protease inhibitor Asunaprevir blocks SMASh cleavage leading to MED14 degradation. (D) Transcriptome analysis of APR-treated Med14SMASh vs. control cells. Red dots represent mRNA spike-ins used to normalize signals on a per cell basis. (E) Med26, PolII, PolII-S5, PolII-S2, H3K4me3, H3K4me1, and H3K27Ac ChIP-Seq profiles at the Xbp1 locus in APR-treated WT (left) or Med14SMASh (right) cells. The orientation of genes is denoted with red arrows.