
Figure 4. Tailless mutant and effect of MED1 and Tail subunit deletions on mMED interaction with PolII and CKM.
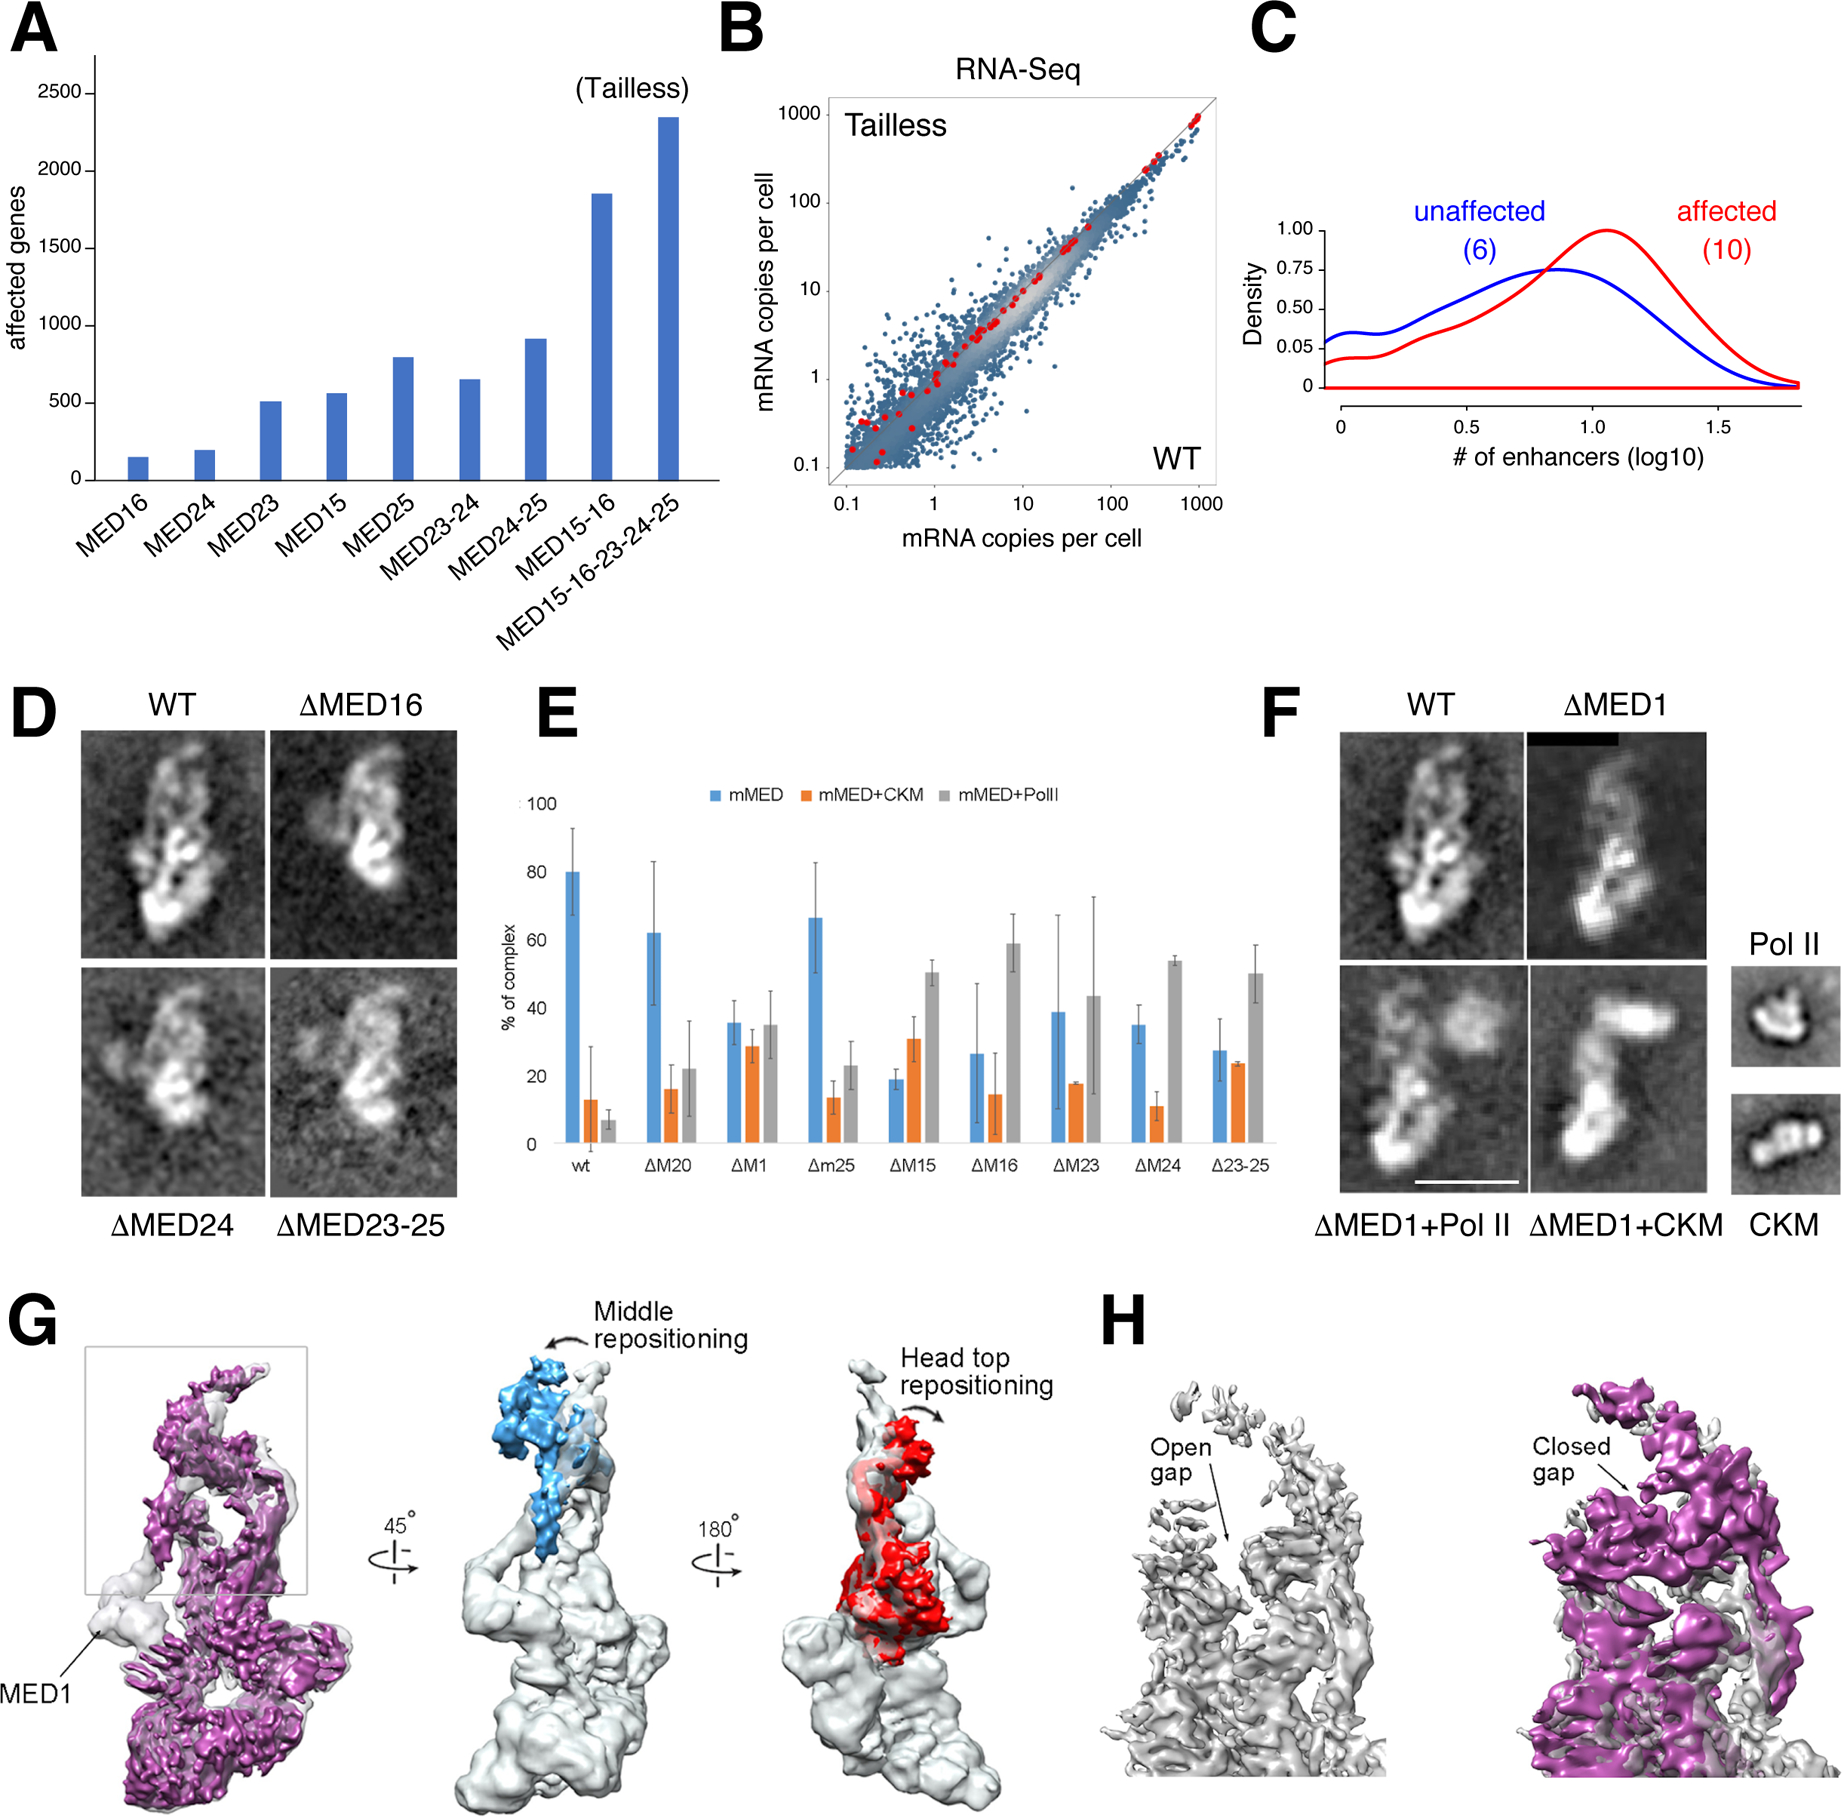
(A) Bar graph denotes transcriptionally affected genes (>1.5 fold) in Tail subunit KOs, including Tailless. (B) Scatter plot compares RNA-Seq from Tailless and WT controls. Red dots are spike-in controls. (C) Histogram showing the number of enhancers associated with affected (red) or unaffected (blue) promoters in Tailless. The median is shown in parenthesis. (D) 2D class averages of WT and single or multiple Tail subunit deletion mutants. Deletion of any subunit in the larger Tail segment (except MED23) results in loss of the entire segment. (E) Effect of MED1 and various Tail subunit deletions on mMED interaction with CKM and PolII. Error bars based on comparison of independent image clustering analyses. (F) 2D class averages calculated from images of ΔMED1, ΔMed1+PolII, and ΔMED1+CKM complexes. PolII and CKM class averages are included for comparison. Scale bar=20nm. (G) Comparison between cryo-EM maps of WT (MED19-FLAG; transparent gray) and ΔMED1 (solid magenta) cryo-EM maps at ~8Å resolution. Loss of MED1 in the ΔMED1 map breaks the connection between the Middle and Tail (leftmost panel) and results in large-scale changes in mMED conformation. The Middle module (blue) and the Head’s neck (red) move closer to each other. (H) Middle-Head repositioning results in closing of the CTD-binding gap (MED19-FLAG transparent gray, ΔMED1 purple; back view opposite to front view shown in leftmost panel).