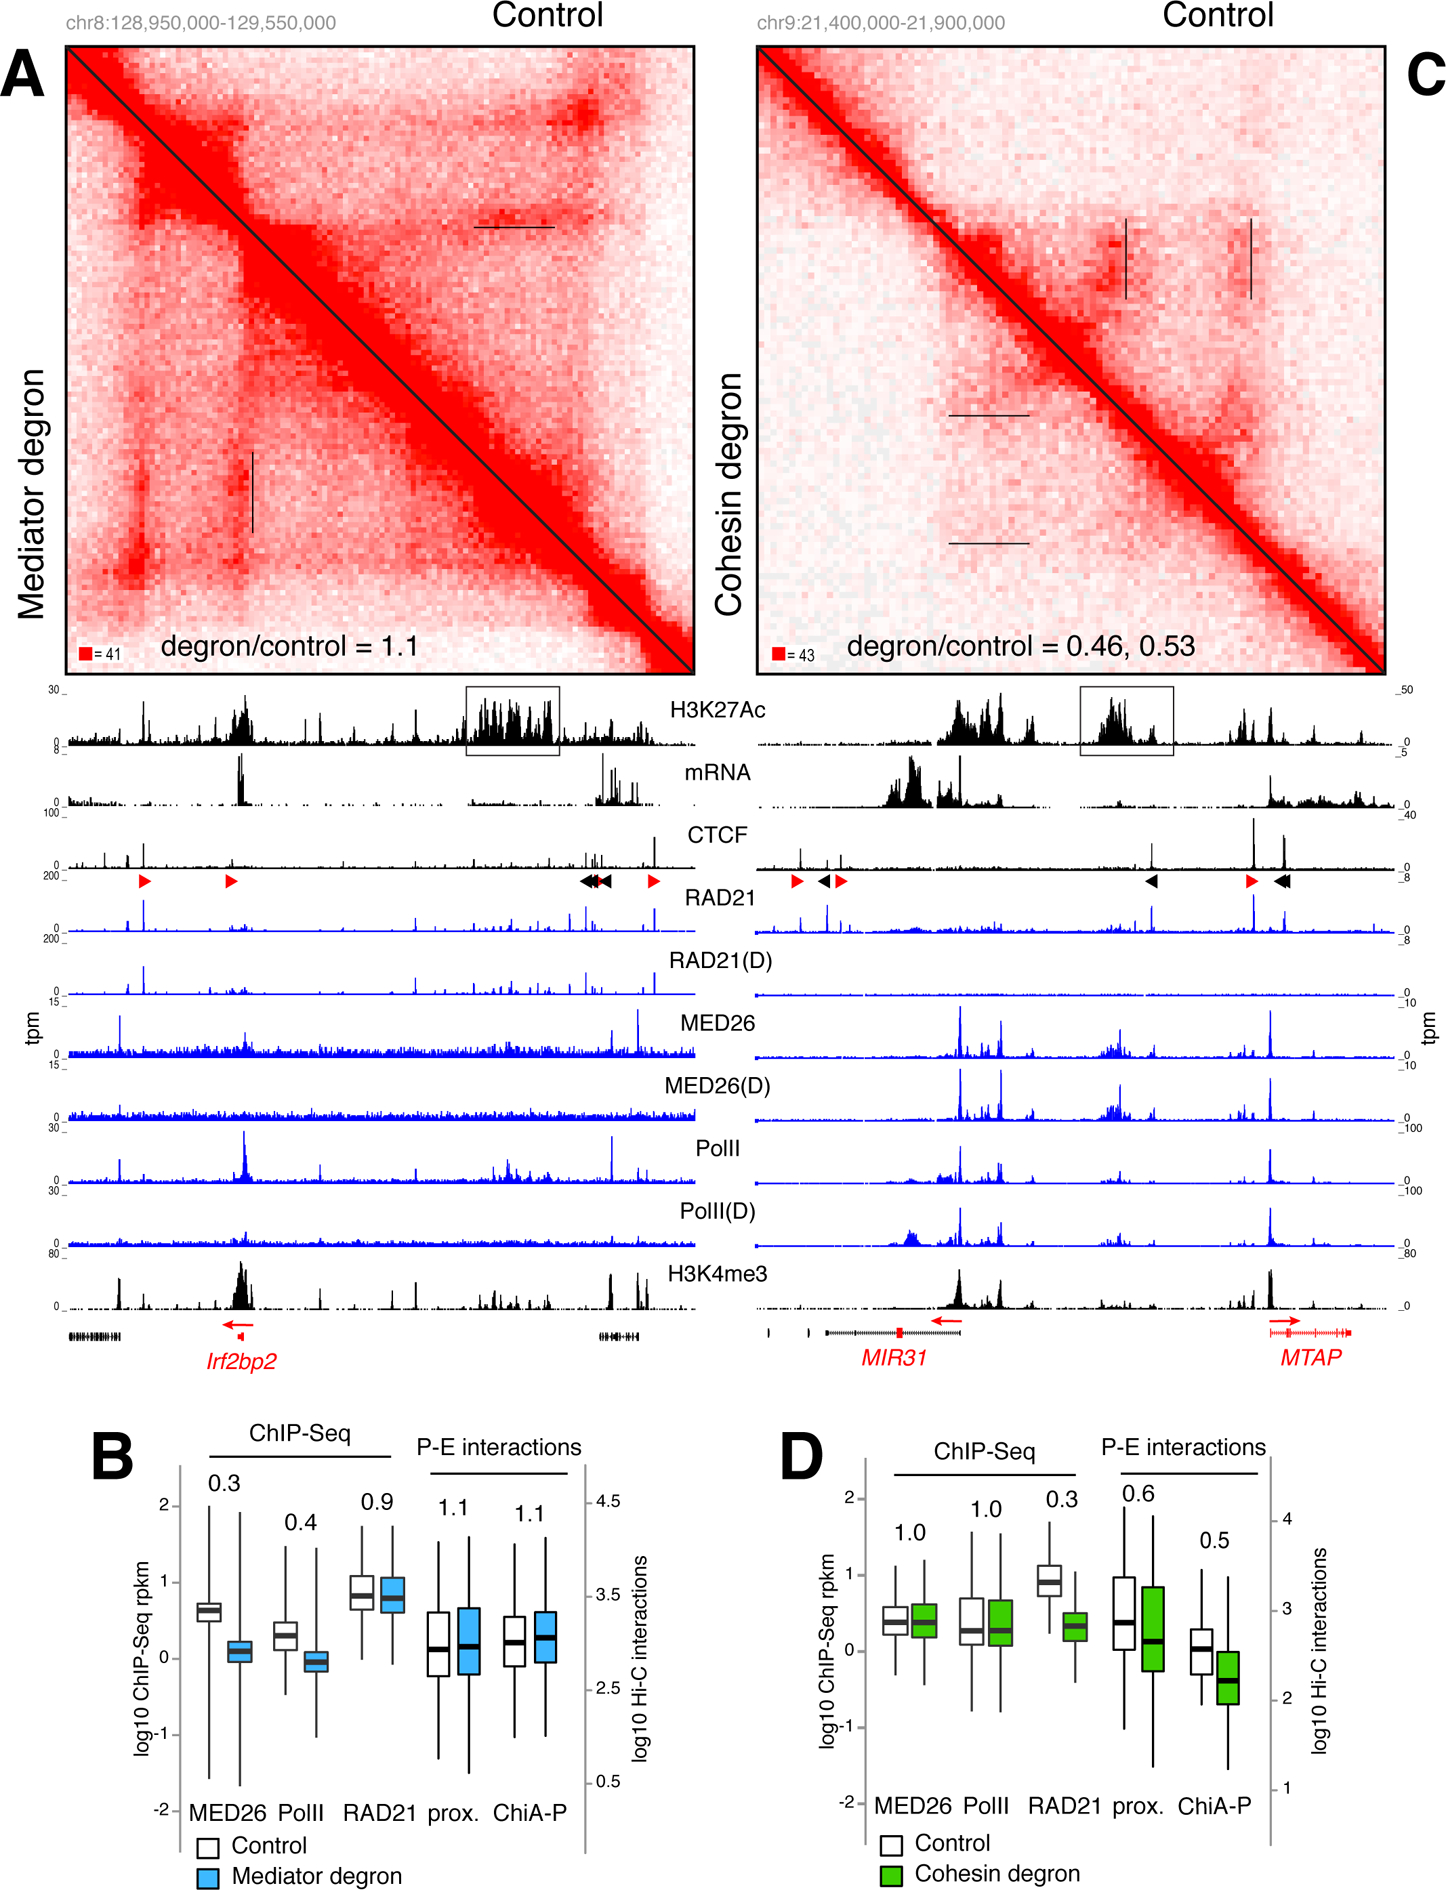
Figure 5. P-E interactions are largely impervious to acute removal of Mediator and PolII but dependent on cohesin.

(A) Hi-C contact matrices for the Irf2bp2 locus in Mediator degron (lower left) vs. control WT cells (upper right). Irf2bp2 promoter-SE contacts are underlined in the matrices and the ratio of Hi-C signals between degron and control (1.1) are indicated. H3K27Ac, mRNA, CTCF, RAD21, MED26, PolII, and H3K4me3 ChIP-Seq tracks are shown and the SE is boxed. D = degron treatment. (B) Box plot comparing MED26, PolII, and RAD21 signals in control (empty) or Mediator degron (blue) cells. Comparison of P-E interactions as determined by enhancer proximity (left) or ChIA-PET (right) are shown. (C) Same analysis as in A for the MIR31 locus in HCT116 RAD21 degron and controls cells. Hi-C signal ratio for MIR32 and MTAP promoters are 0.45 and 0.53 respectively. (D) Same analyses as in B for HCT-116 cells. For B and D data are represented as mean +/− SEM.
