
Figure 7. The impact of Mediator Tail deletion on promoter-enhancer interactions.
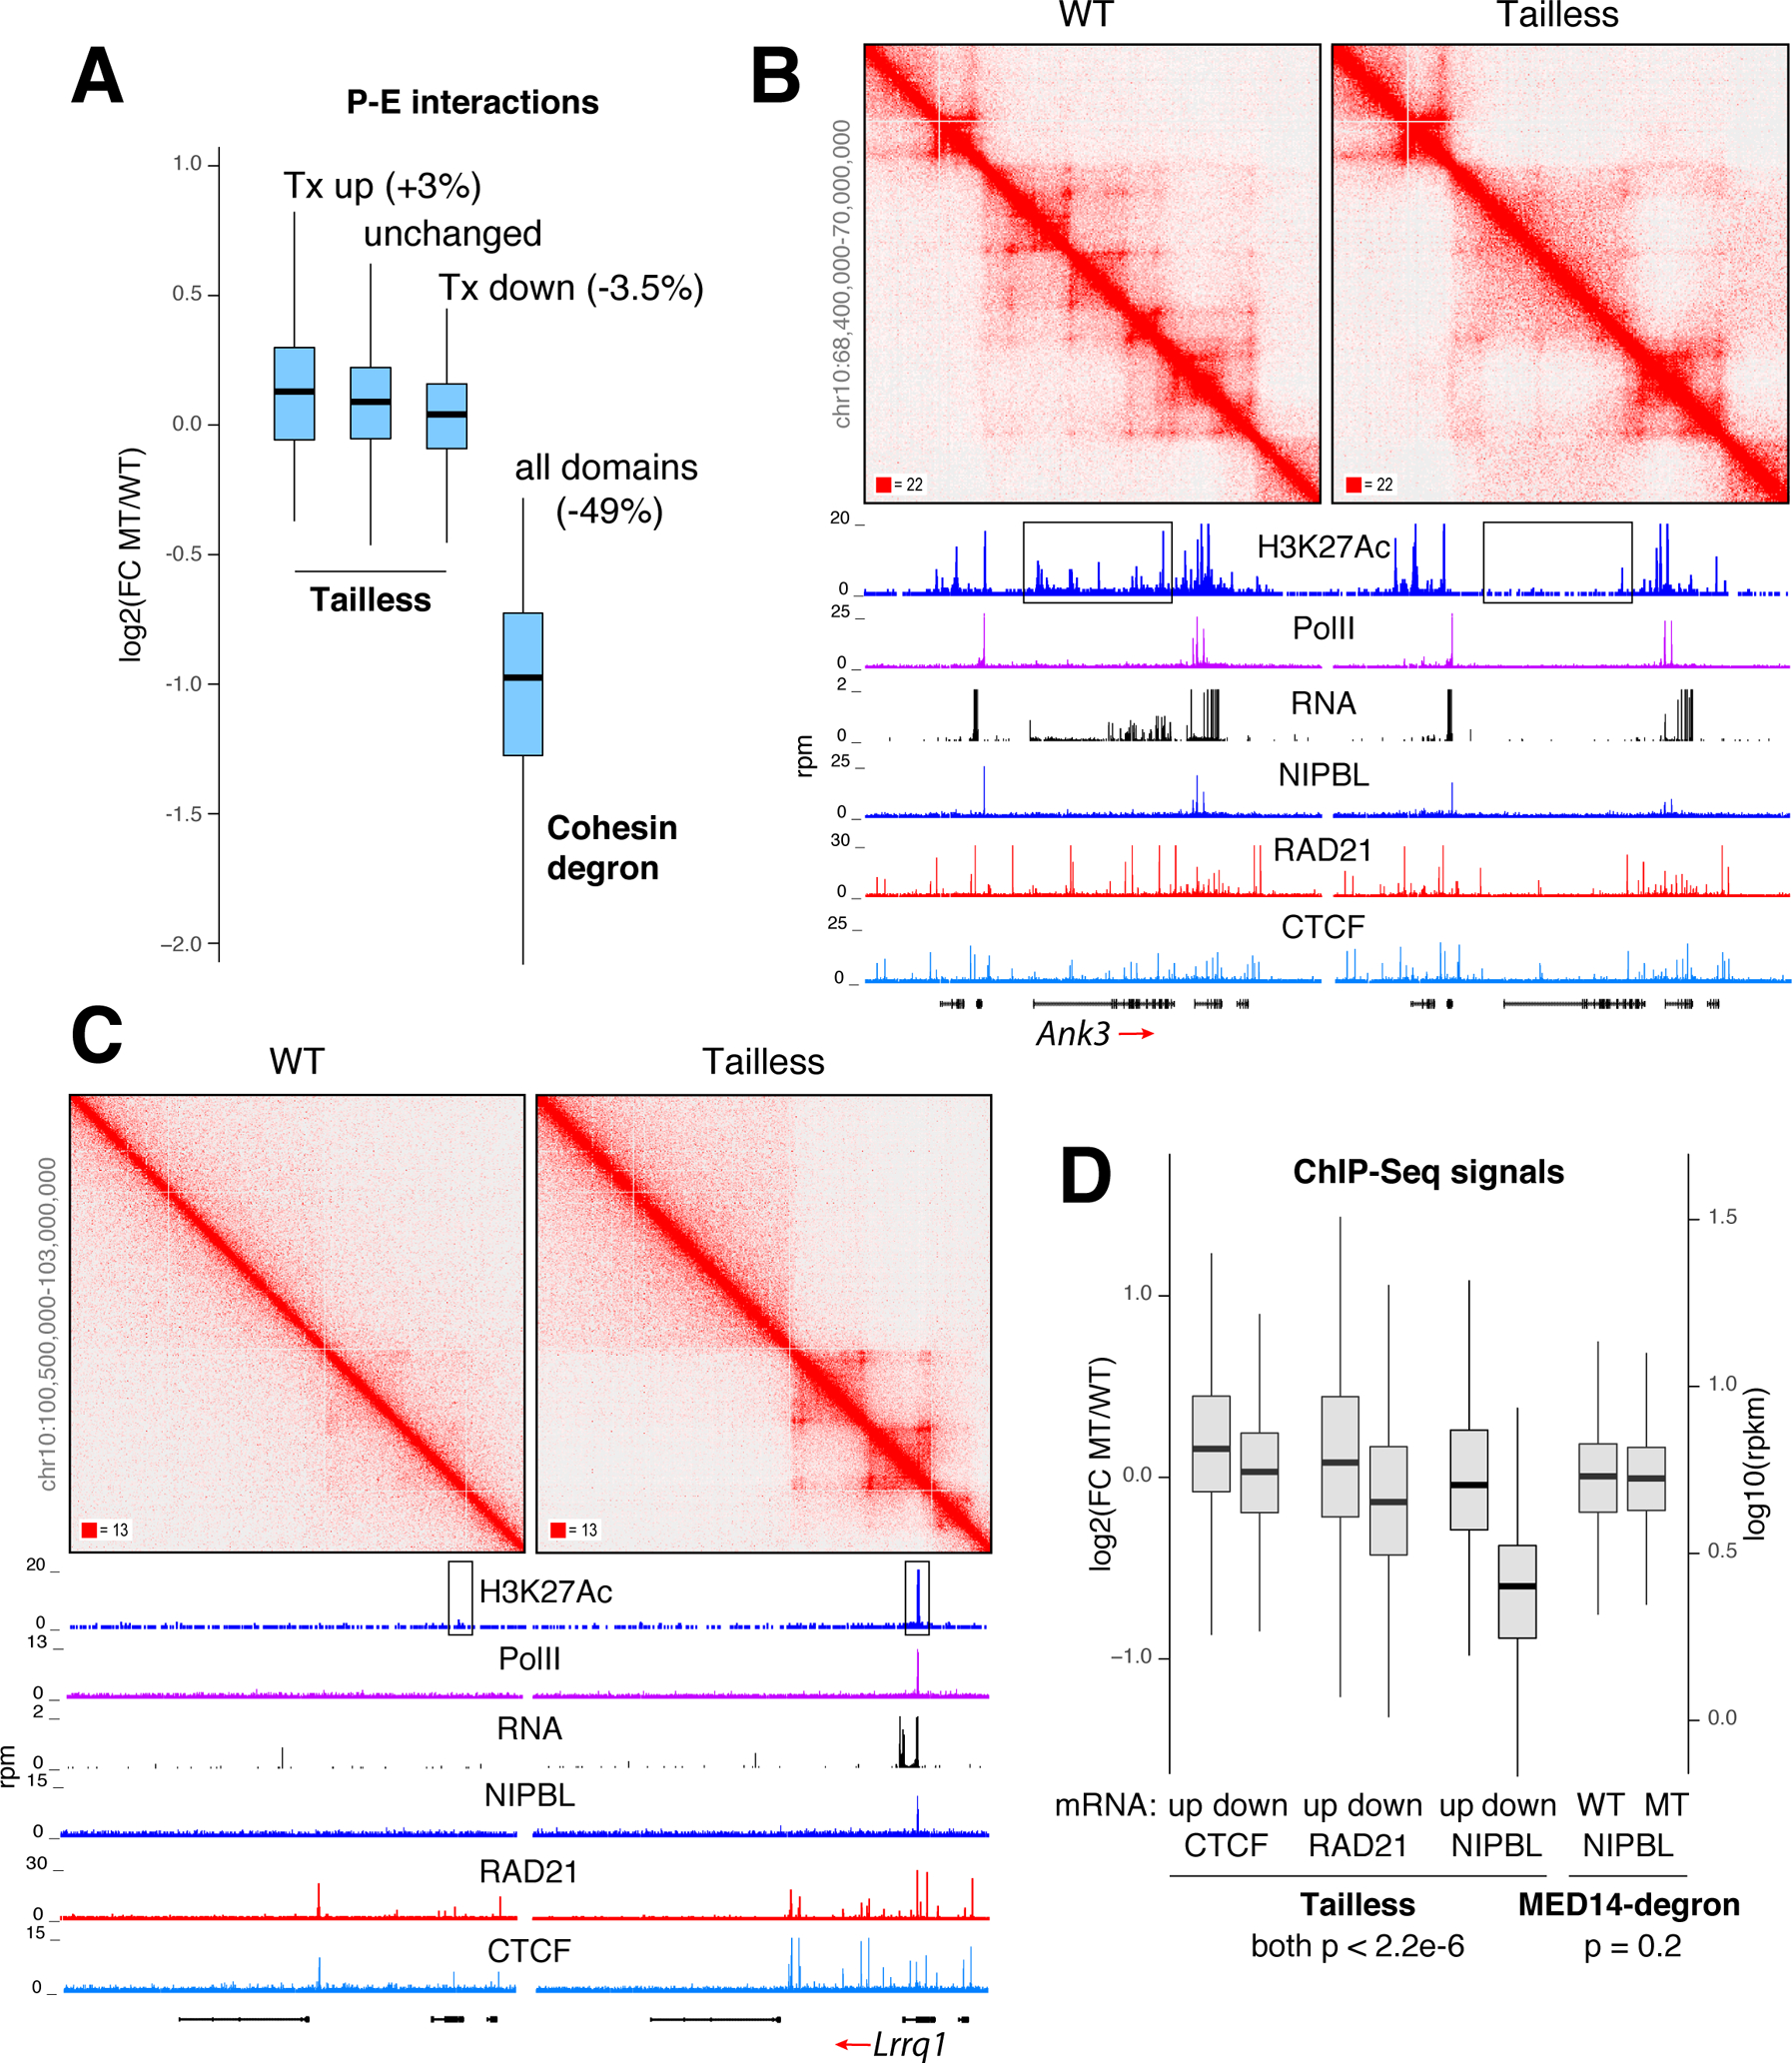
(A) Box plot showing changes in promoter-enhancer interactions at loop domains where transcription is increased, unchanged, or decreased in Tailless cells. For comparison, global changes in P-E interactions in cohesin-degron cells relative to control are shown. (B) Example of loop domains lost in Tailless. Profiles of H3K27Ac, PolII, RNA, NIPBL, RAD21 and CTCF occupancy are shown. Enhancer area is boxed. (C) Example of gained loop domains. (D) Box plot showing changes in CTCF, RAD21, and NIPBL recruitment at loop domains showing an increase or decrease in transcription in Tailless. NIPBL signals in Mediator-degron and control are shown for comparison. For A and D data are represented as mean +/− SEM.