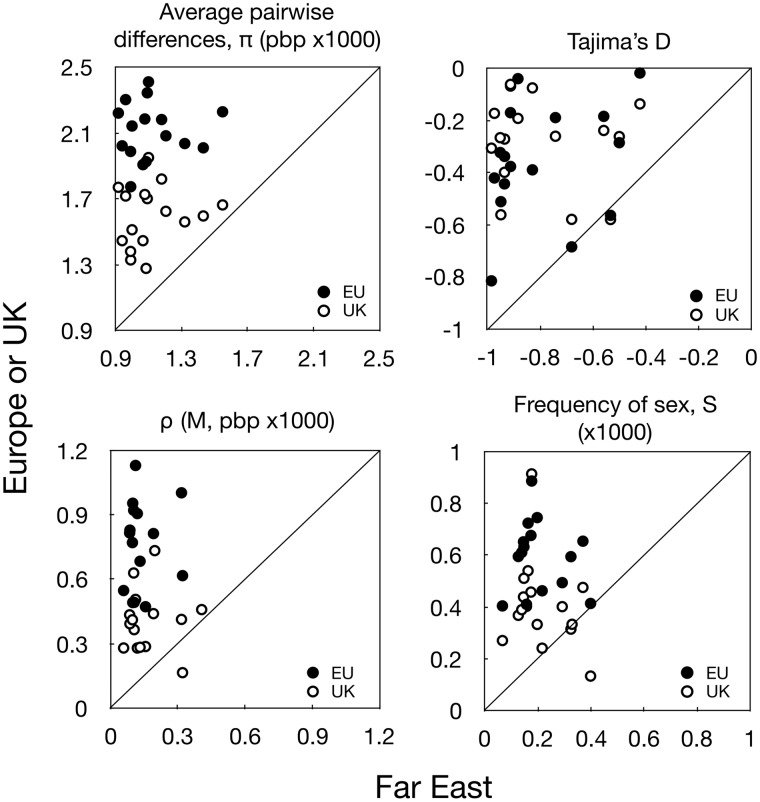
Fig. 1.
Population genetic parameters for the European and UK-only populations plotted against the Far East population. Points are for different chromosomes (n = 16). Top, left and right: Nucleotide diversity (average pairwise differences, π; pbp ×1,000) and Tajima’s D calculated for 4-fold degenerate sites. For diversity, all points are above the 1:1 line, showing higher diversity in both Europe and UK alone than in the Far East. Tajima’s D values are negative showing excess rare mutations in both populations, suggesting population expansion in both, with lower expansion in Europe. Bottom, left and right: Estimated recombination parameter (ρ) and frequency of sex (S) for European and UK-only populations, plotted against Far East. Again, points are above the 1:1 line, showing higher rates of recombination and frequency of sex, in both Europe and UK; note one point is omitted from the recombination plot (but included in all analyses), as it represents an outlier for recombination in Europe (but not in UK or FE).

