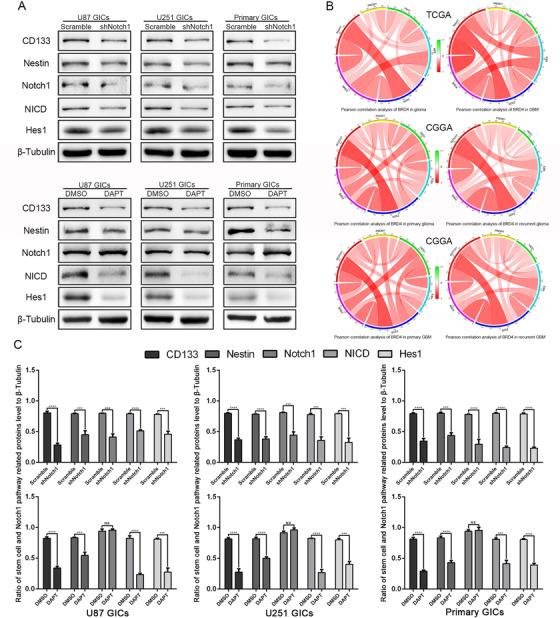
FIGURE 5.

Notch1 regulated the protein expression of stem cell markers in BRD4 overexpression GICs, and Pearson correlation analysis of BRD4 with Notch1, Hes1, Nestin, CD133, and SOX2 in TCGA and CGGA databases. (A) Cells were treated the same as in (Picture 4). (A,C) Protein expressions of Notch1 pathway and stem cell markers were detect by western blot. Data are shown as means ± SD, n = 3, #P = NS, *P < .05,**P < .01, ***P < .001, ****P < .0001, Student's t‐test. (B) Pearson correlation analysis between BRD4 and Notch1 pathway, stem cell markers in TCGA and CGGA data sets
