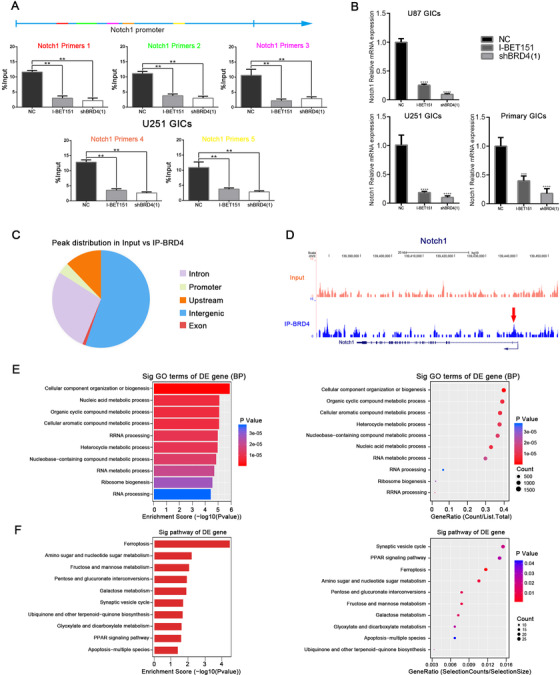
FIGURE 6.

BRD4 was enriched in the Notch1 promoter region and occupied cell metabolism genes regulatory regions in U251 GICs. (A) BRD4 ChIP qPCR at promoters of Notch1. IgG was used as a reference, n = 3. (B) The effect of silencing Notch1 was validated by RT‐PCR. Statistical analysis was performed by using one‐way ANOVA followed by Tukey's post‐hoc test. Data represent means ± SEM. **P < .01. (C) Pie chart showing BRD4 distribution in input versus IP‐BRD4. (D) BRD4 ChIP‐seq tracks of Notch1gene. Bottom to top: IP‐BRD4, Input. (E‐F) Gene ontology analysis and KEGG pathway analysis of genes with higher BRD4 enrichment in U251 GICs of Input versus IP‐BRD4
