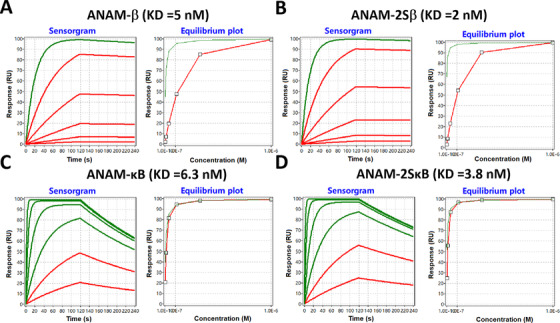
FIGURE 2.

Protein binding characterization of ANAMs. SPR‐based RNA binding characterization was performed. Representative SPR sensorgrams and equilibrium binding plots of the ANAM‐β (A), ANAM‐2Sβ (B), ANAM‐κB (C), and ANAM‐2SκB (D) are shown. The association and dissociation portions from each protein at six different concentrations are included in the sensorgrams. K D, equilibrium constant. In the sensorgram, the curves that reach less than 95% equilibrium at the end of the analyte injection time are red and the curves above this value are green. The concentrations represented by these curves (from top to bottom) are: 1.0 × 10⁻⁶ M, 3.3 × 10⁻⁷ M, 1.1 × 10⁻⁷ M, 3.7 × 10⁻⁸ M, 1.2 × 10⁻⁸ M, and 4.1 × 10⁻⁹ M, respectively
