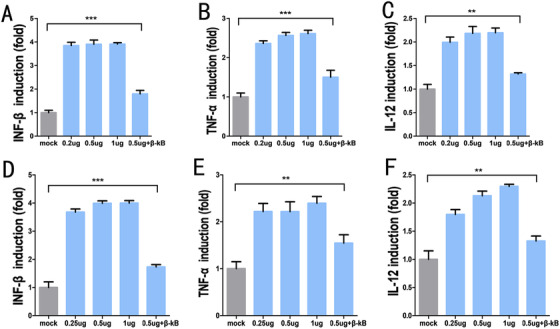
FIGURE 4.

Expression of type I interferons and inflammatory cytokines measured by qPCR. In 293t cells, 0.2 μg, 0.5 μg, 1 μg of plasmid induced the expression of INF‐β (A), TNF‐α (B), and IL‐12 (C). In the presence of ANAM‐β‐κB in 293t cells, 0.5 μg of plasmid slightly induced the expression of INF‐β (A), TNF‐α (B), and IL‐12 (C). In 5637 cells, 0.2 μg, 0.5 μg, 1 μg of plasmid induced the expression of INF‐β (D), TNF‐α(E), and IL‐12 (F). In 293t cells, 0.5 μg of plasmid slightly induced the expression of INF‐β (D), TNF‐α (E), and IL‐12 (F) in the presence of ANAM‐β‐κB. All experiments were repeated three times. ** P < .05, *** P < .001 compared to the mock group
