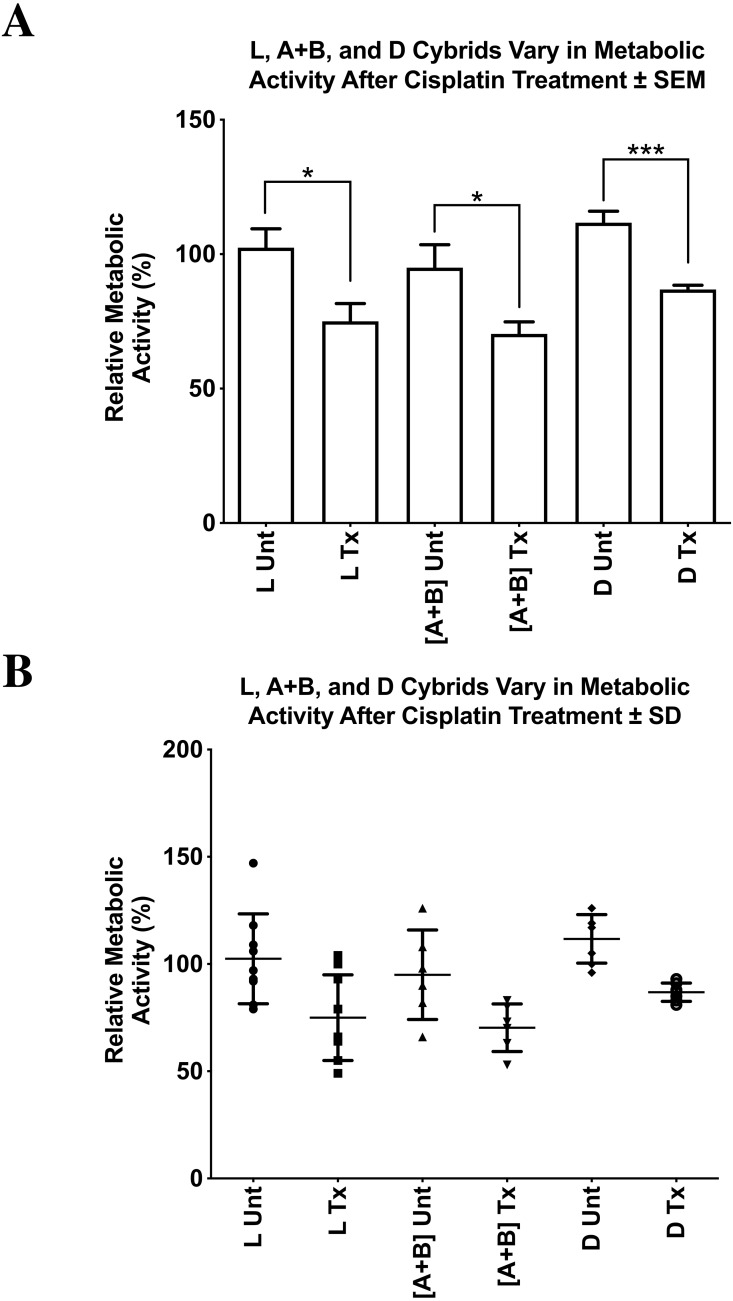
Figure 6. L, [A+B], and D cybrids vary in relative cellular metabolic activity after cisplatin treatment.
L, [A+B], and D cybrids in the fifth passage were cultured and then plated on 96-well plates with each well containing 50,000 cells. After 24 h, media were removed, and cells were treated with 100 µL of 40 µM concentration of cisplatin. Plates were then incubated at 37 °C for another 48 h. The MTT assay was conducted to assess relative cellular metabolic activity. Absorbance values were measured on an absorbance reader at 570 nm (measured) and 630 nm (reference). (A) All values were normalized to the average of the untreated-L cybrids and displayed as the mean ± Standard Error Margin (SEM). The distribution of each value was also presented in a dot-plot graph representing mean ± Standard Deviation (SD). The cisplatin-treated-L cybrids showed the greatest reduction in relative cellular metabolic activity compared to the untreated-L cybrids (B) (75.0% ± 6.7% SEM; SD = 20.0%, n = 7; 102.4% ± 7.0% SEM; SD = 21.0%, n = 7, respectively) (p = 0.0117). The cisplatin-treated-D cybrids showed a significant decrease in cell viability compared to the untreated-D cybrids (86.9% ± 1.6% SEM; SD = 4.3%, n = 3; 111.7% ± 4.3% SEM; SD = 11.3%, n = 3, respectively) (p = 0.0001). The cisplatin-treated-[A+B] cybrids also had a statistically significant decrease in cellular metabolic activity compared to their respective untreated-[A+B] cybrids (70.3% ± 4.5% SEM; SD = 11.1%, n = 4; 95.0% ± 8.5% SEM; SD = 20.9%, n = 4, respectively) (p = 0.0285). Each treatment was run in quadruplicate and the entire experiment was repeated twice. ∗p < 0.05; ∗∗p < 0.01; ∗∗∗p < 0.001.

