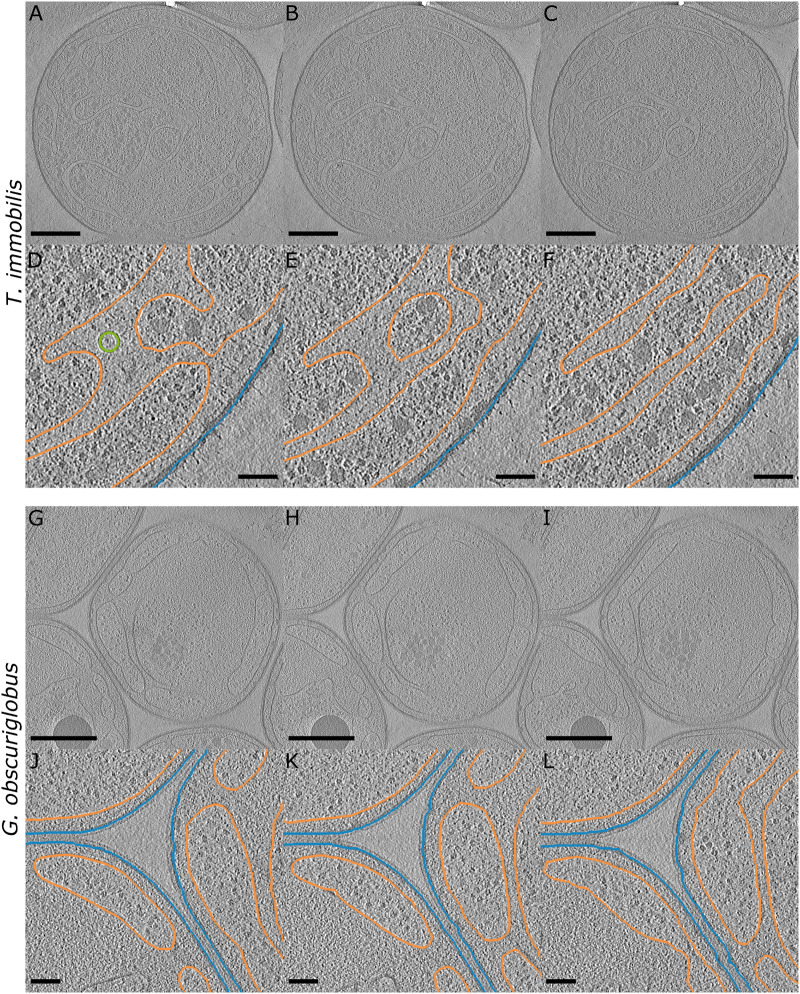
Fig. 1.
Cryo-electron tomographs of Tuwongella immobilis and Gemmata obscuriglobus cells. (A–C and G–I) Tomographs of T. immobilis and Gem. obscuriglobus with interslice distances of 50 voxel (37 nm); scale bar: 500 nm, thickness: 1 voxel; for corresponding full tomogram, see supplementary movies 1 and 4, Supplementary Material online. (D–F and J–L) Partial segmentation of inner membrane (orange), outer membrane (blue), and membrane vesicle (green) of the corresponding tomographs shown in (A–C) and (G–I). Scale bar: 100 nm.

