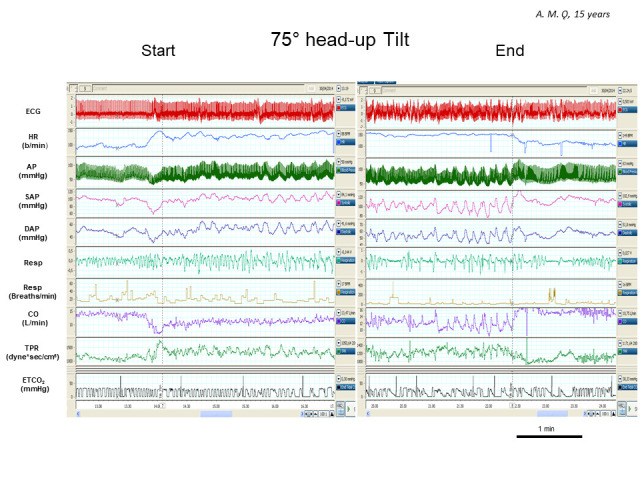
Figure 1. Representative example of multiparameters recording during a PPS attack in a young female undergoing a tilt test maneuver. The End graph (right panel) refers to the last 4 minutes of the PPS episode. Note absence of alterations in the hemodynamics, i.e. heart rate and blood pressure, and in the respiratory rate during the attack (right panel). In addition, during tilt, there was a proper increase of heart rate and TPR, blood pressure was unmodified and CO declined compared to the supine position, as expected. The only feature suggestive of the patient’s distress was the respiratory pattern. Indeed, this latter was more irregular (see ETCO2 trace) during PPS attack than in baseline supine position and during early tilt (left panel). Vertical dashed lines indicate the start (left) and the end (right) of the tilt maneuver.

HR indicates heart rate; AP, arterial pressure; SAP, systolic arterial pressure; DAP, diastolic arterial pressure; Resp, respiratory activity; CO, cardiac output; TPR, total peripheral resistances; ETCO2 , end-tidal carbon dioxide partial pressure.
