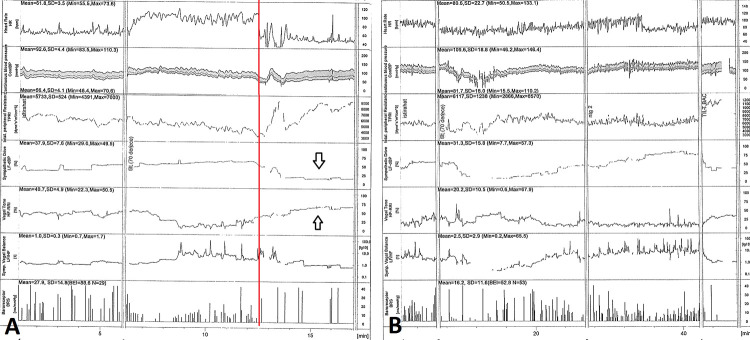
Figure 4. Hemodynamic results of head-up tilt table test before (A) and at 6th months of follow-up after cardioneuroablation (B).
Top trace shows the heart rate curve; bottom trace shows continuous blood pressure curves. Blood pressure stabilizes shortly after the assumption of the upright position with no changes for the duration of the preparatory phase; the heart rate immediately rises, then stabilizes. The vertical red line indicates the time of onset of the vasovagal reaction, which is characterized, at first, by a mild decrease in blood pressure with a steep fall in heart rate and syncope occurs. A. Arrows demonstrate a decrease on sympathetic tone and increase on parasympathetic tone before cardioneuroablation. B. After cardioneuroablation, vagal tone stays stable during tilting.
HR=heart rate; BP=blood pressure

