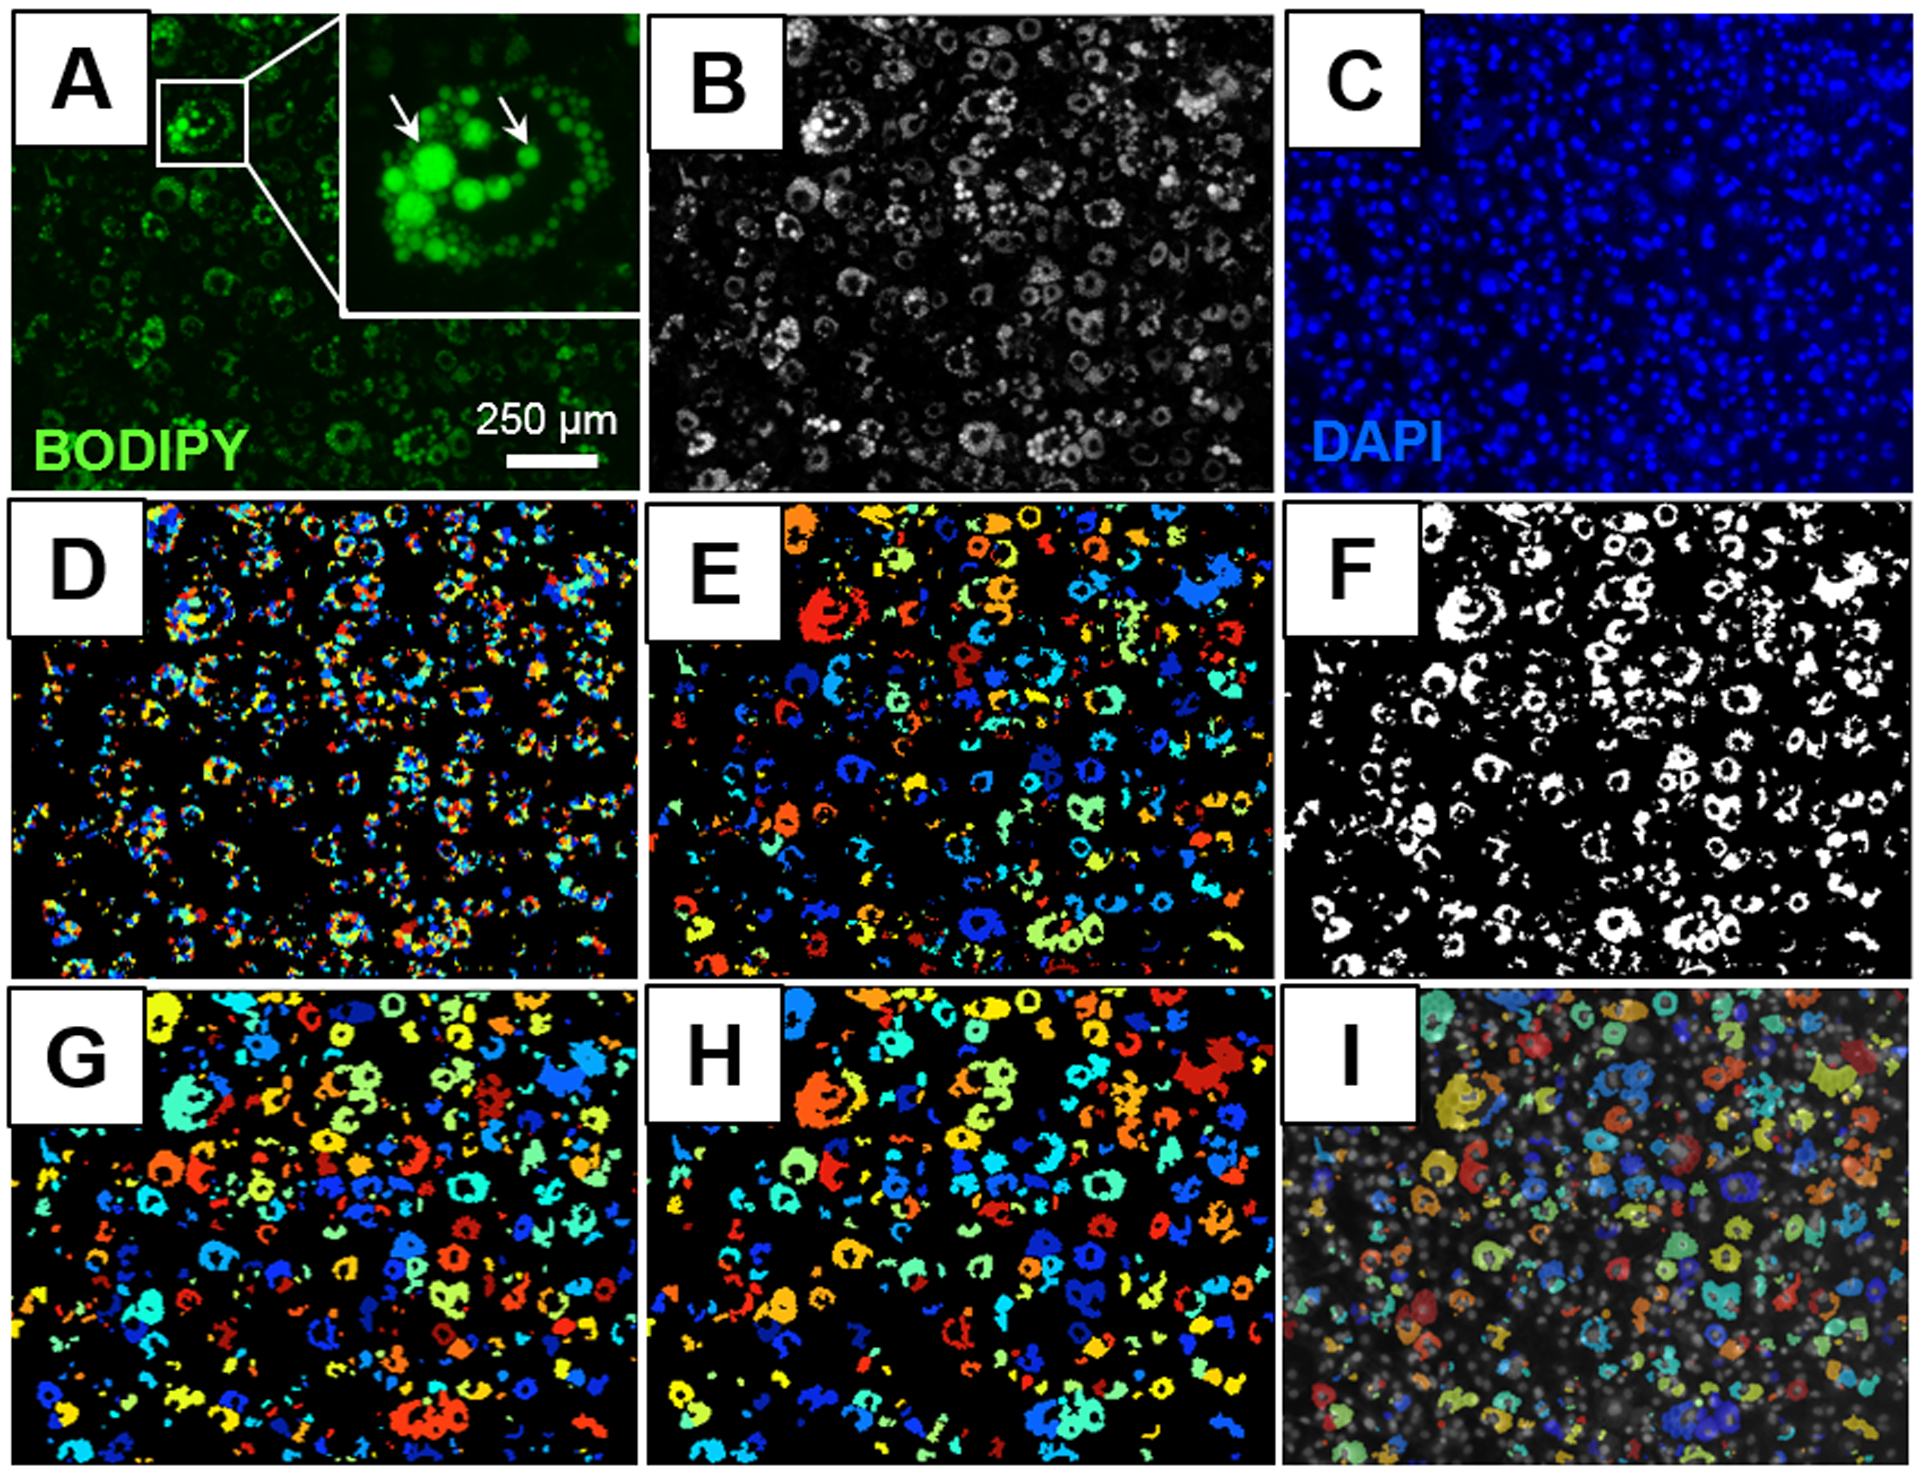
Figure 2. Sample image processing using CellProfiler.

(A) Original image of differentiated adipocytes with a high density of BODIPY stained lipid droplets. Image also contains a magnified picture of a differentiated adipocyte to model the diversity in lipid droplet sizes within a single cell. (B) Conversion of original image to grayscale using the “ColorToGray” module. (C) Corresponding image of DAPI stained nuclei. (D) Identified lipid droplets using the “IdentifyPrimaryObjects” and “FilterObjects” modules. (E) Touching lipid droplets were grouped together using the “SplitOrMergeObjects” module. (F) Identified objects from the “SplitOrMergeObjects” module were converted to a binary image using the “ConvertObjectsToImage” module. (G) Adipocytes were identified by size, shape, and intensity from the binary image using the “IdentifyPrimaryObjects” module. (H) Objects below the area threshold were excluded from the final analysis using the “FilterObjects” module. (I) Differentiated adipocytes were overlaid with corresponding nuclei using the “OverlayObjects” module.
