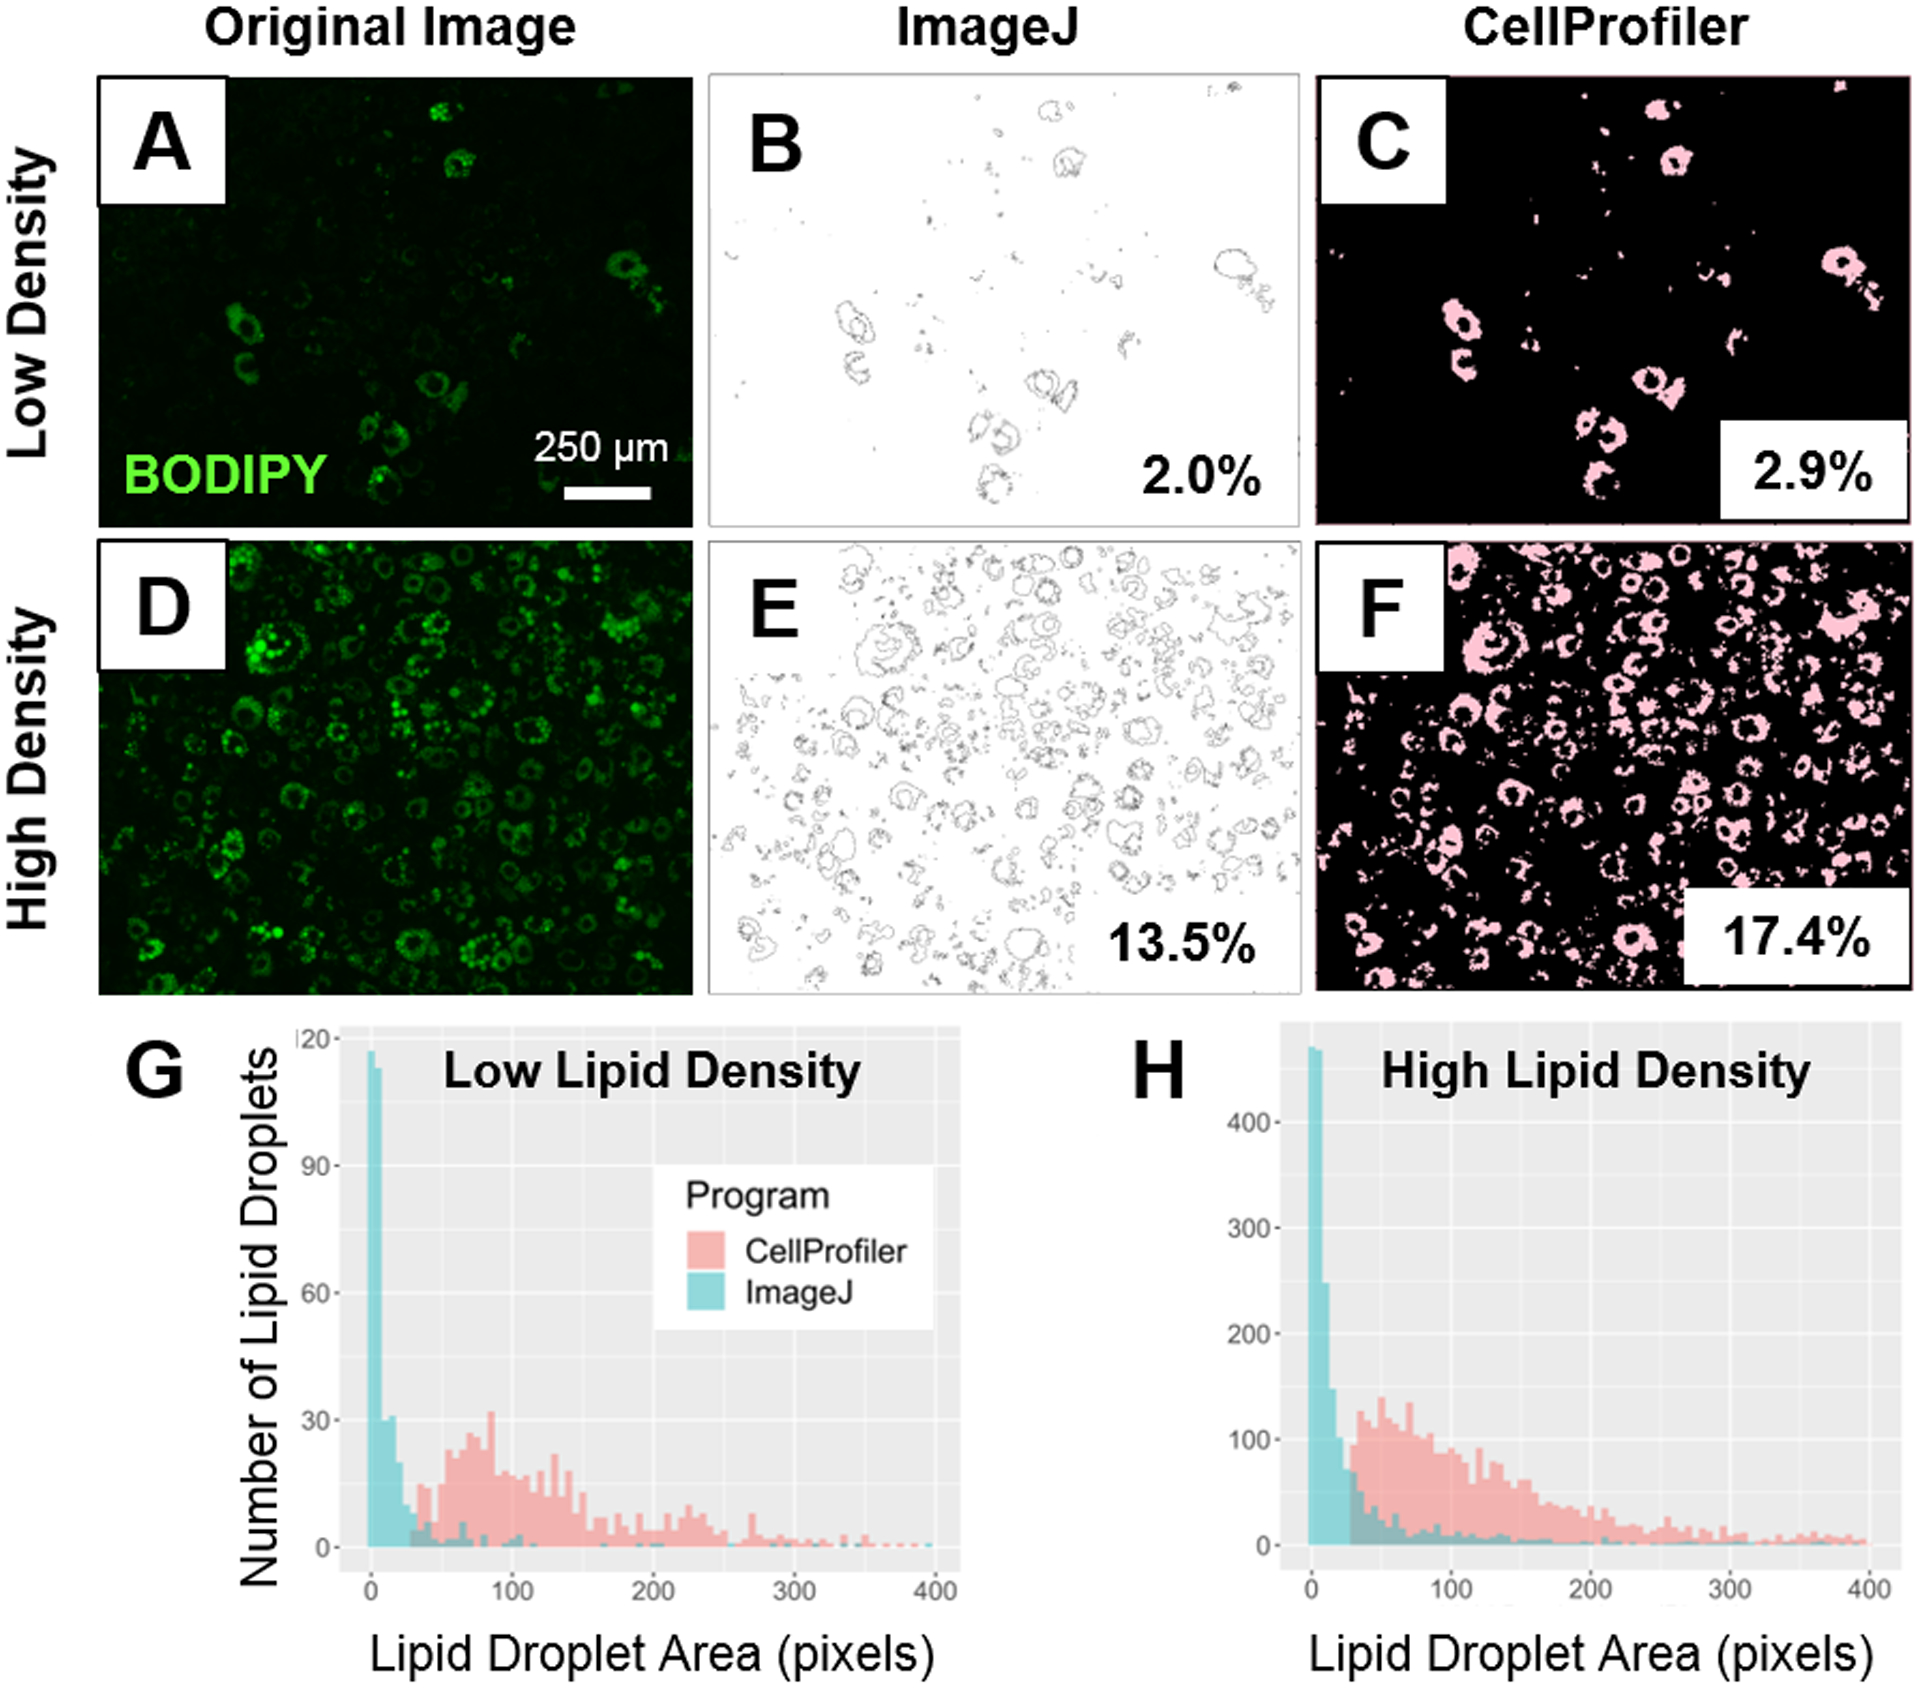
Figure 3. Comparing lipid area identified by ImageJ and CellProfiler in low vs. high lipid droplet content images.

Top: Original image with low density lipid content (A) and corresponding processed images with identified percent positive lipid area identified by ImageJ (B) and CellProfiler (C). Original image with high density lipid content (D) and corresponding processed images with identified percent positive lipid area identified by ImageJ (E) and CellProfiler (F). Bottom: Comparison of the individual lipid droplet area quantification between ImageJ and CellProfiler (G, H). Lipid droplet area distribution in a sample image with low (G) and high (H) density of lipid droplets in CellProfiler (red) and ImageJ (blue).
