
Figure 4. Clustering Analysis by CellProfiler.
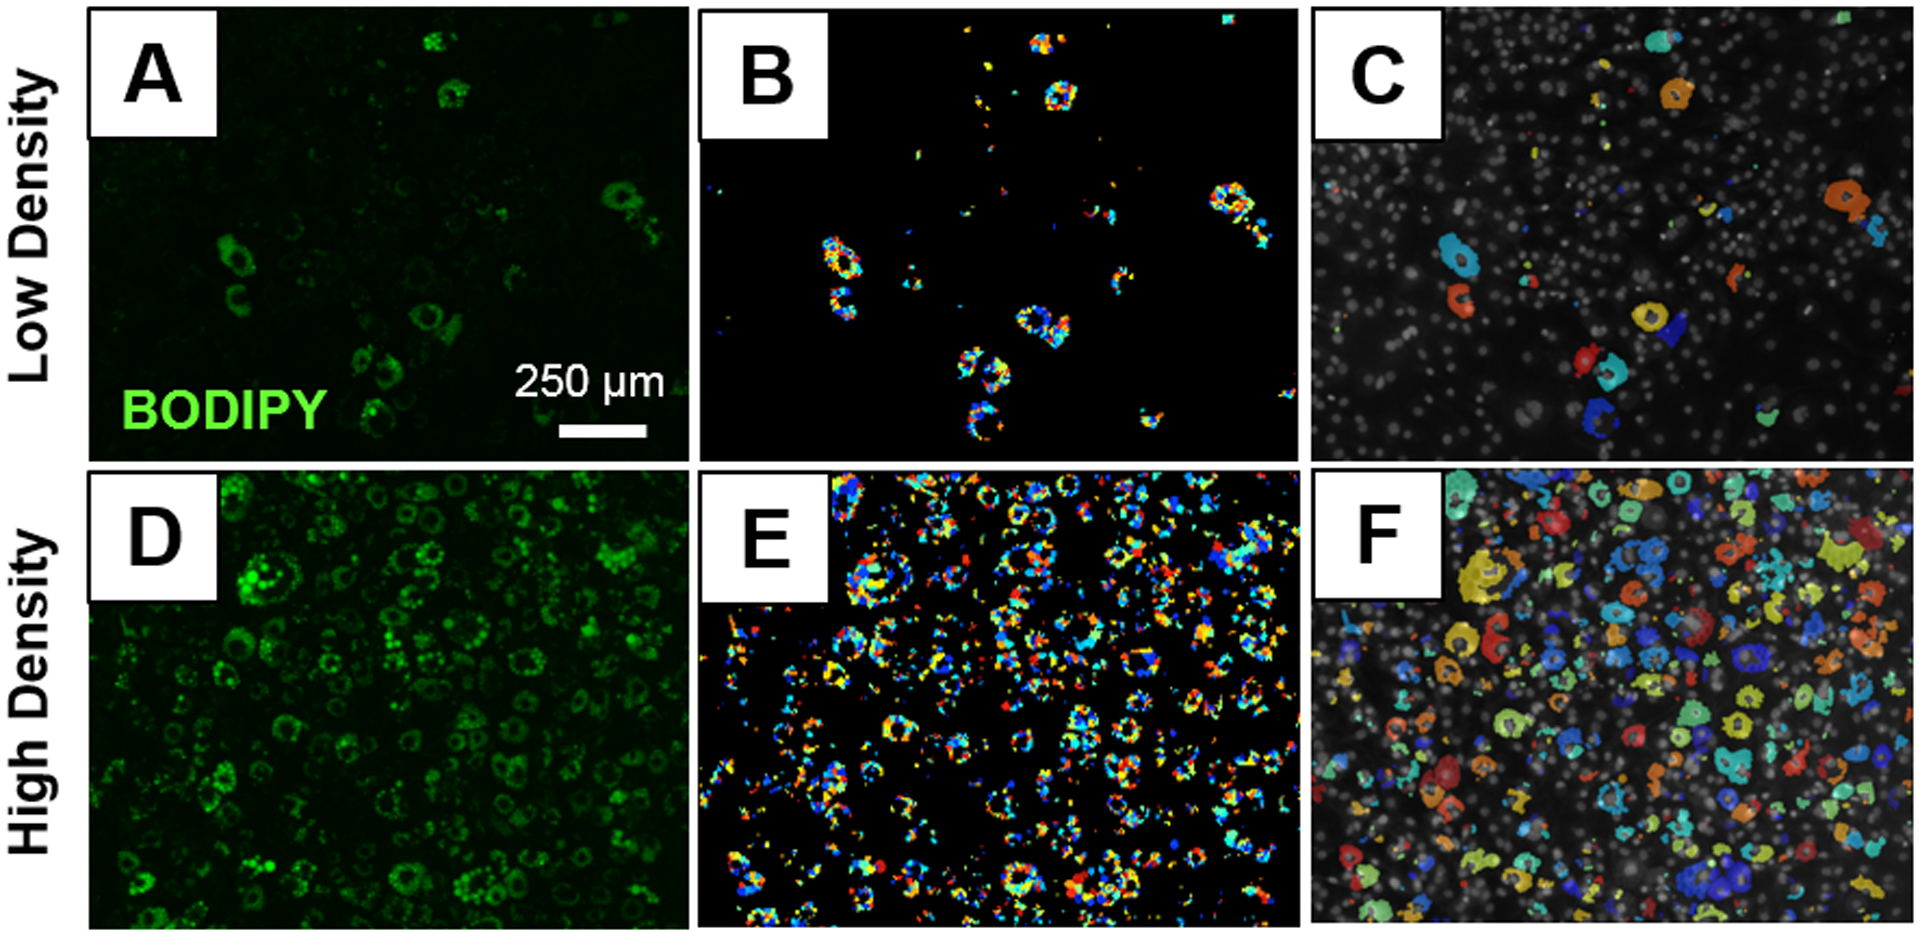
Original BODIPY stained images with low (A) and high (D) lipid content. Individual lipid droplets identified on low (B) and high (E) lipid density images. Clusters of adipocytes identified on low (C) and high (F) density images.