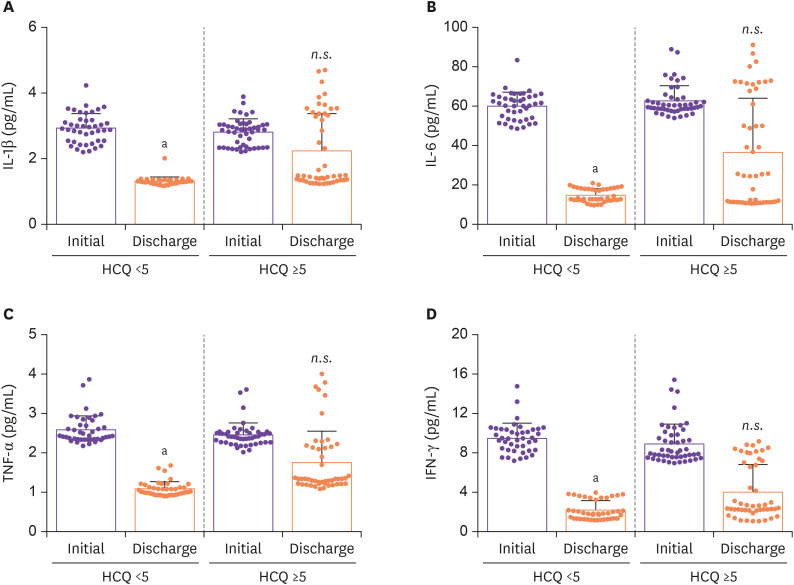
Figure 2. Series of comparisons of plasma cytokines levels in patients at initial and at discharge after HCQ administration. Statistical analysis was performed using a two-tailed unpaired t-test. In all analyses, a two-tailed P-value <0.05 was considered to indicate statistical significance. Data are presented as mean ± SEM.
aP <0.01.
bP <0.05.
HCQ, hydroxychloroquine; SEM, standard error of the mean; n.s., not significant.
All statistical analyses were performed using SPSS software (ver. 24.0; SPSS Inc., Chicago, IL, USA) and Graphpad Prism.

