
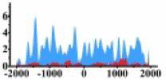
Table 3.
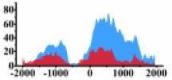
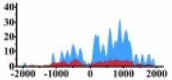
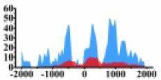
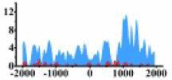
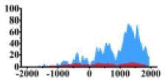
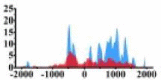
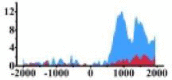
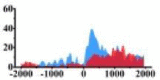
Genes and important distribution regions of histone modification signals that related to HCC. (A) is the oncogenes, (B) is the tumor suppressor genes.
| (A) | |||||||||||||||
|---|---|---|---|---|---|---|---|---|---|---|---|---|---|---|---|
| GENE (ONCO) | H3K4me3 |
H3K9ac |
H3K27ac |
H3K4me2 |
H3K79me2 |
||||||||||
| DISTRIBUTION | DHMR (bp) | Δ | DISTRIBUTION | DHMR (bp) | Δ | DISTRIBUTION | DHMR (bp) | Δ | DISTRIBUTION | DHMR (bp) | Δ | DISTRIBUTION | DHMR (bp) | Δ | |
| MYD88 | 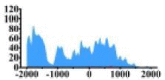 |
(−2000, −1300) (−1000, 1000) |
↑ |  |
(−2000, −1500) (−1000, 0) |
↑ | |||||||||
| MYC | 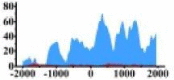 |
(−1300, −700) (−500, 2000) |
↑ |  |
(0, 1500) | ↑ | 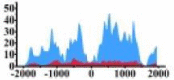 |
(−1800, −800) (−800, −100) (200, 1500) |
↑ | ||||||
| ARHGAP5 | 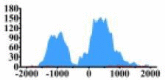 |
(−1500, −500) (0, 1000) |
↑ |  |
(0, 1500) | ↑ | 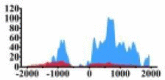 |
(−1000, −500) (0, 1500) |
↑ |  |
(−1500, −500) (1000, 2000) |
↑ |  |
(500, 2000) | ↑ |
| PLCG1 | 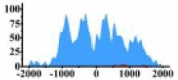 |
(−1000, 1500) | ↑ | 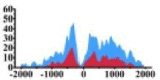 |
(−500, −200) (0, 1500) |
↑ |  |
(0, 1200) | ↑ | 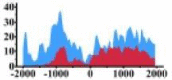 |
(−1500, −500) | ↑ | |||
| MDM2 | 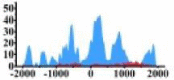 |
(−1000, −300) (0, 500) (500, 1000) |
↑ |  |
(−1000, −300) (0, 500) (500, 1500) |
↑ | |||||||||
| MET | 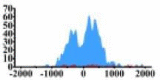 |
(−800, 800) | ↑ | 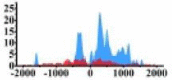 |
(−500, 0) (0, 1200) |
↑ | |||||||||
| ETV4 | 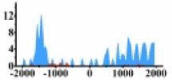 |
(−1700, −1200) (1000, 2000) |
↑ |  |
(1000, 2000) | ↑ | 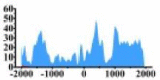 |
(−1700, −1000) (0, 500) (1000, 2000) |
↑ | ||||||
| HLF | 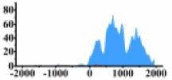 |
(0, 2000) | ↑ | 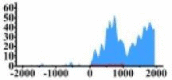 |
(0, 2000) | ↑ | 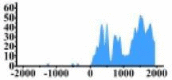 |
(0, 2000) | ↑ | 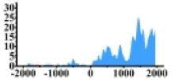 |
(0, 1000) (1200, 2000) |
↑ | |||
| ERBB3 | 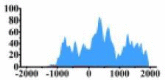 |
(−1000, 2000) | ↑ | 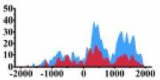 |
(300, 800) (1000, 2000) |
↑ |  |
(0, 2000) | ↑ | ||||||
| MAP2K1 | 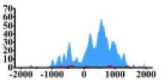 |
(0, 1500) | ↑ | 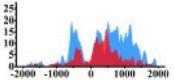 |
(−700, −300) (800, 1500) |
↑ |  |
(500, 1500) | ↑ | 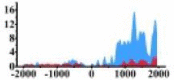 |
(700, 2000) | ↑ | |||
| MALT1 | 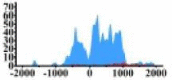 |
(−800, 1000) | ↑ | 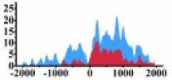 |
(200, 1500) | ↑ | 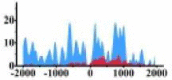 |
(−2000, 0) (0, 500) (700, 1100) |
↑ |  |
(500, 2000) | ↑ | |||
| CCND1 | 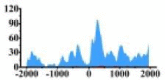 |
(−2000, −1500) (−1000, −2000) |
↑ |  |
(0, 500) | ↑ | 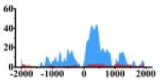 |
(0, 800) | ↑ | ||||||
| CHD4 | 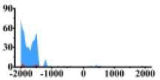 |
(−2000, −1500) | ↑ | 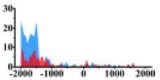 |
(−2000, −1400) | ↑ | 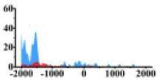 |
(−2000, −1400) | ↑ | ||||||
| (B) | |||||||||||||||
|---|---|---|---|---|---|---|---|---|---|---|---|---|---|---|---|
| GENE (TSG) | H3K4me3 |
H3K9ac |
H3K27ac |
H3K4me2 |
H3K27me3 | ||||||||||
| DISTRIBUTION | DHMR (bp) | Δ | DISTRIBUTION | DHMR (bp) | Δ | DISTRIBUTION | DHMR (bp) | Δ | DISTRIBUTION | DHMR (bp) | Δ | DISTRIBUTION | DHMR (bp) | Δ | |
| CREB3L1 | 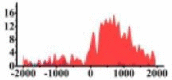 |
(0, 1500) | ↓ | 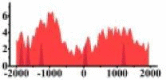 |
(−1500, −300) (300, 2000) |
↓ |  |
(−500, 2000) | ↓ | 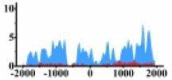 |
(−1800, −500) (−300, 2000) |
↑ | |||
| ROBO2 | 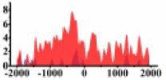 |
(−1500, 500) | ↓ | 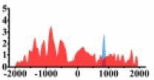 |
(−1500, 500) | ↓ | 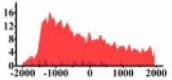 |
(−1500, 2000) | ↓ | 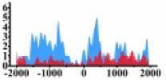 |
(−1500, −500) (0, 500) |
↑ | |||
| BTG1 | 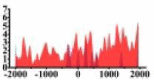 |
(−2000, −500) (700, 2000) |
↓ |  |
(1000, 2000) | ↓ | 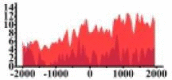 |
(−1000, 2000) | ↓ | ||||||
| ACKR3 | 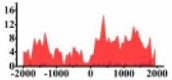 |
(−2000, −800) (0, 2000) |
↓ |  |
(−2000, 1300) | ↓ | 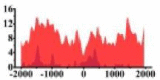 |
(−1500, 500) (500, 2000) |
↓ |  |
(−1500, 2000) | ↑ | |||
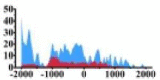
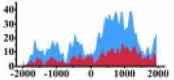
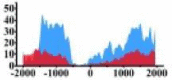
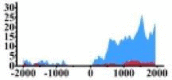
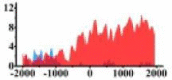
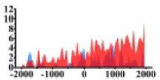
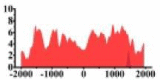
In the distribution maps of histone modification signals, the blue represents the distribution of histone modification signals in tumor cell line and the red represents the distribution of histone modification signals in normal cell line. The Δ represents the change of histone modification signals in tumor cell line relative to normal cell line, the ↑ represents increasing of histone modification signals, the ↓ represents weakening of histone modification signals. Abbreviations: HM: histone modification. DHMR: differentially histone modification regions in tumor cell line.