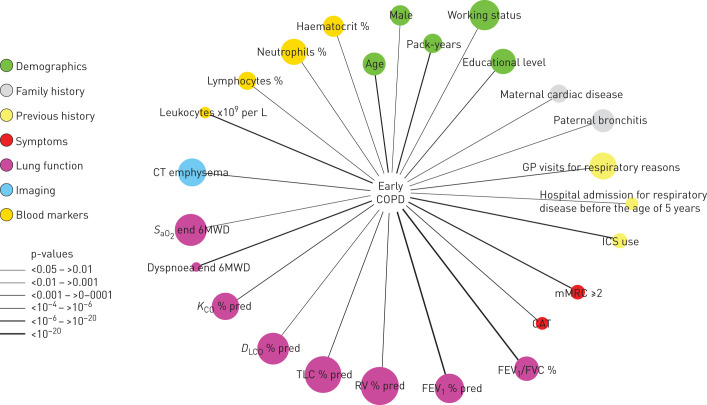
FIGURE 3.
Variables associated (p<0.05) with the presence of early COPD in the population studied. Node colour indicates variable category (see legends), node size is proportional to the prevalence of abnormal values of that particular variable and edge (link) width is proportional to p-values (see legends). For further explanations, see text.

