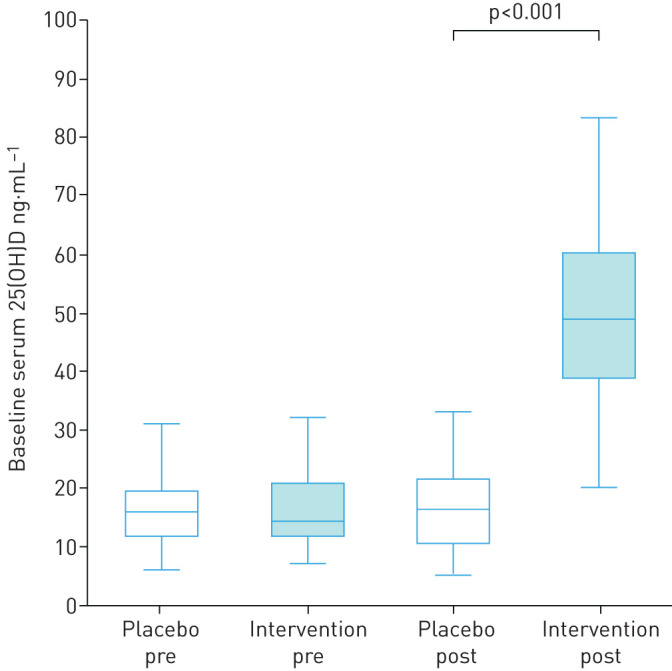
FIGURE 1.

25(OH)D levels in placebo and intervention groups at baseline and 12 months. Boxplots (5th percentile, 1st quartile, median, 3rd quartile and 95th percentile) showing serum 25(OH) levels (ng.mL−1) at baseline (pre; n=71 in both groups) and 12 months (post; n=61 in placebo arm and n=56 in intervention arm). No significant difference in serum 25(OH)D levels was found between the placebo and intervention arm at baseline. 25(OH)D levels were significantly higher in the intervention arm compared to the placebo arm at 12 months (p<0.001).
