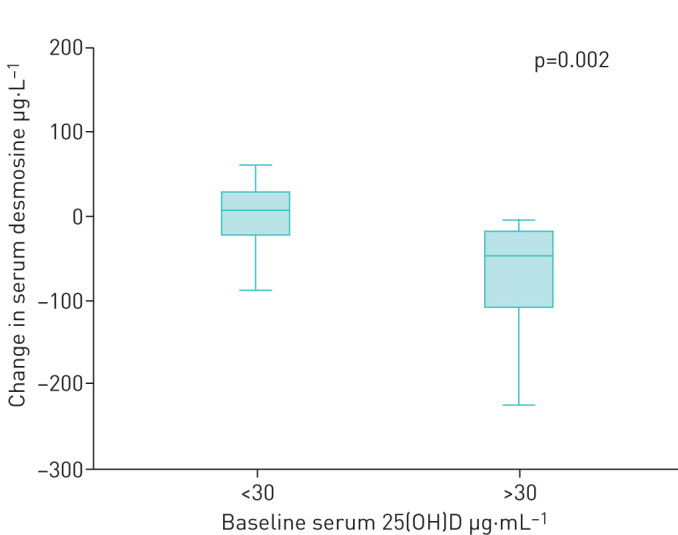
FIGURE 4.

Effect of baseline 25(OH)D levels on desmosine change after vitamin D supplementation. Boxplots (5th percentile, 1st quartile, median, 3rd quartile and 95th percentile) showing the change in plasma desmosine levels (µg.L−1) over the course of the study and serum 25(OH)D levels (ng.mL−1) at baseline. A significant inverse correlation was found between the groups (p=0.002).
