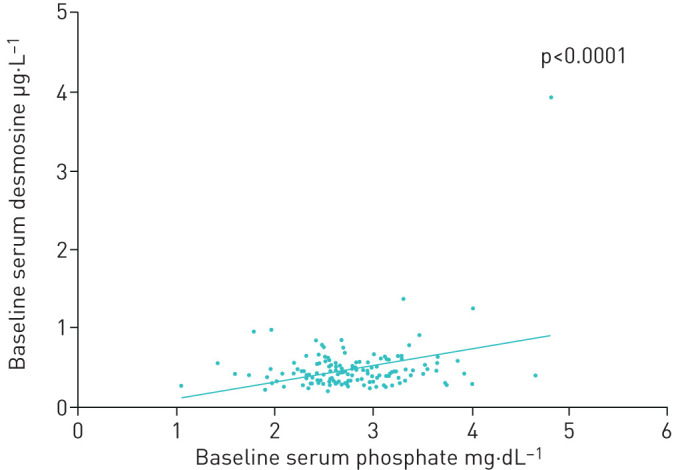
FIGURE 5.

Association between phosphate and desmosine levels at baseline. Scatterplot showing the association between baseline serum phosphate (mg.dL−1) and plasma desmosine levels (µg.L−1). All 142 patients from both the placebo and intervention group were included. A significant positive association was found between both variables (p<0.0001). Plasma desmosine = −0.739 + (age)*0.008 − (baseline serum phosphate)*0.233 (η2=0.157 and adjusted η2=0.145).
