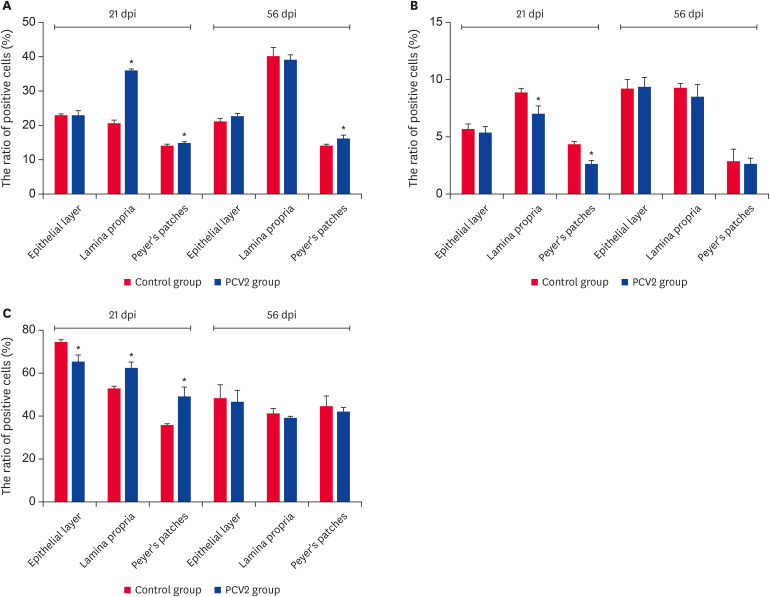
Fig. 5. The ratio of T lymphocytes, CD4+T lymphocytes and CD8+T lymphocytes in the epithelial layer, lamina propria and Peyer's patches at 2 time points. (A) Ratio of total T lymphocytes. (B) Ratio of CD4+T lymphocytes. (C) Ratio of CD8+T lymphocytes. The values represent the positive cell rate (%) (n = 3 per group). One hundred percent represents all cells in this experiment. The error bars represent SDs.
PCV2, porcine circovirus type 2; dpi, days post-infection.
*p < 0.05.

