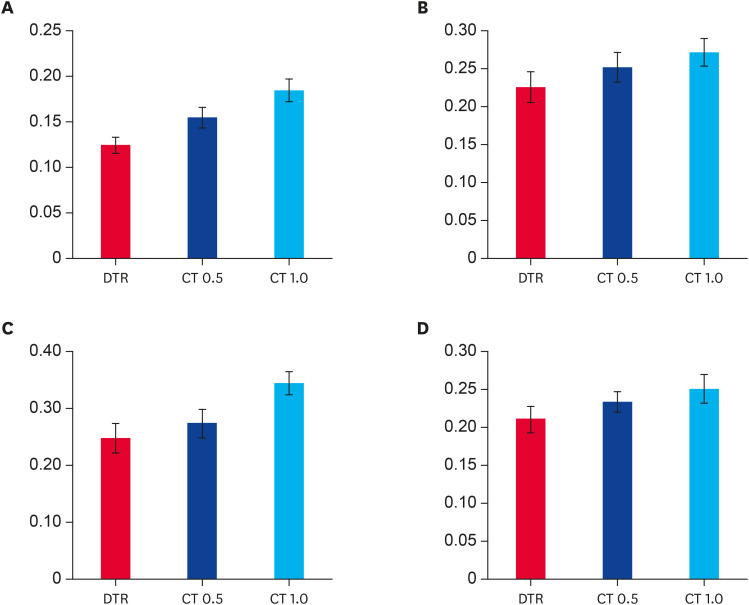
Fig. 2. Difference of P/T ratio according to measurement method of dogs (A) and cats (B) and difference of POS of dogs (C) and cats (D). In both dogs and cats, P/T ratio and POS were measured significantly larger (p < 0.001) in CT 0.5 than DTR, and larger in CT 1.0 than CT 0.5.
P/T ratio, pulp-cavity to tooth width ratio; POS, periodontal space; DTR, dental radiography; CT 0.5, 0.5 mm slice thickness computed tomography; CT 1.0, 1.0 mm slice thickness computed tomography.

