
FIGURE 4.
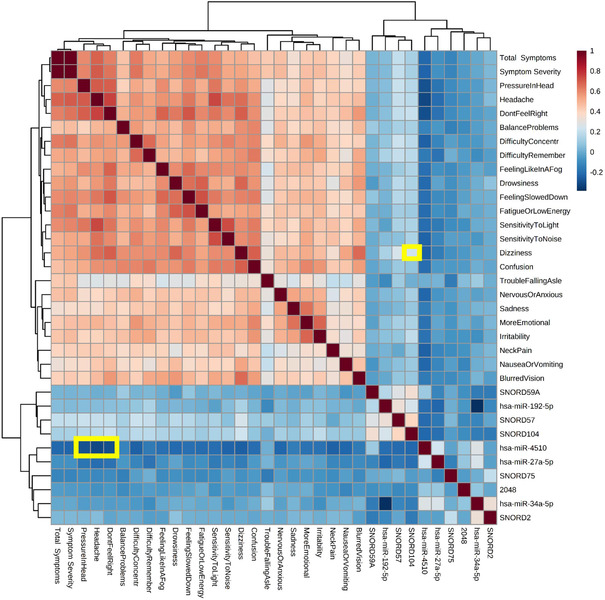
Associations between diagnostic noncoding RNAs and subjective symptom reports. The heatmap displays Pearson associations among 10 “diagnostic” salivary noncoding RNAs (ncRNAs), and 22 mTBI symptoms, as well as symptom burden and symptom severity. Saliva ncRNA was measured with high‐throughput sequencing and symptoms were self‐reported on the Post‐Concussion Symptom Scale by 321 participants (mTBI = 176; control = 145) at the time of enrollment. Color scales denote strength of association, where blue represents negative Pearson R‐values and red represents positive Pearson R‐values. Significant associations ([R] > .25; FDR < 0.001) between ncRNA features and specific mTBI symptoms are highlighted in yellow. Hierarchical clustering determined feature order