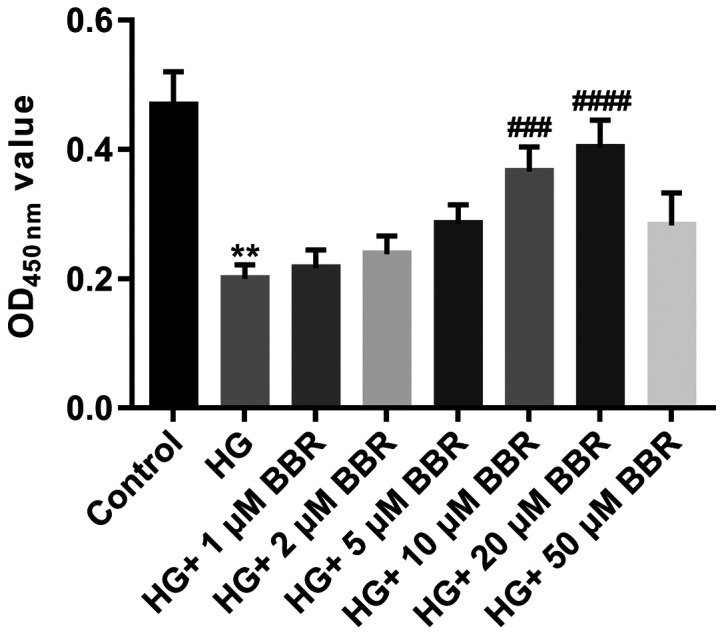
Figure 2.

Effect of BBR on Müller cell viability. Müller cells were treated with 5.5 mM glucose; 33.3 mM glucose; 33.3 mM glucose and 1 µM BBR; 33.3 mM glucose and 2 µM BBR; 33.3 mM glucose and 5 µM BBR; 33.3 mM glucose and 10 µM BBR; 33.3 mM glucose and 20 µM BBR; or 33.3 mM glucose and 50 µM BBR. Cell viability was assessed using the Cell Counting Kit-8 assay. **P<0.01 vs. the control group. ###P<0.001 and ####P<0.0001 vs. the HG group. BBR, berberine; HG, high glucose; OD, optical density.
