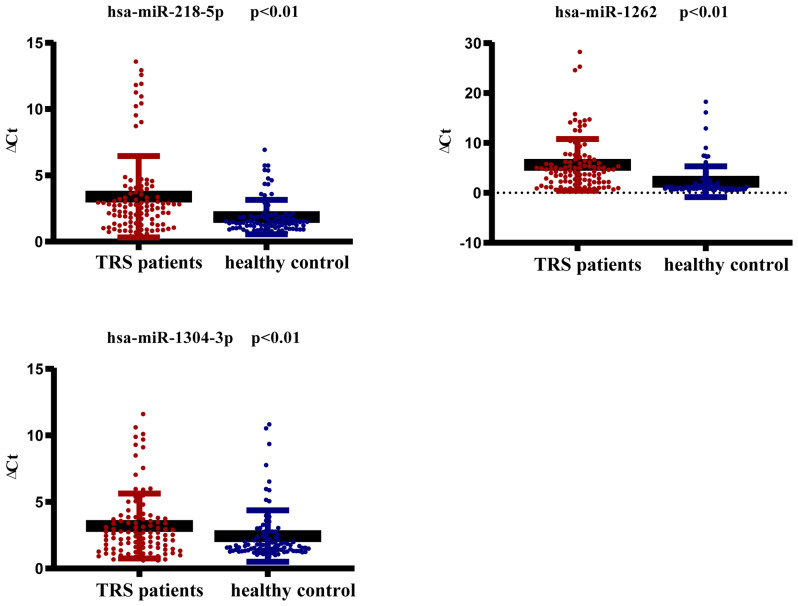
Figure 2.
Reverse transcription-quantitative PCR was performed to verify the expression of miRNAs from peripheral blood mononuclear cells in a large sample (TRS, n=34; control, n=31). miRNA levels are normalized to H-actin. GraphPad Prism 7 was used to plot the data and the Mann-Whitney U-test was performed and analyze significant differences. Data are presented as the mean ± SD. TRS, treatment-resistant schizophrenia; miRNA/miR, microRNA; hsa, Homo sapiens.

