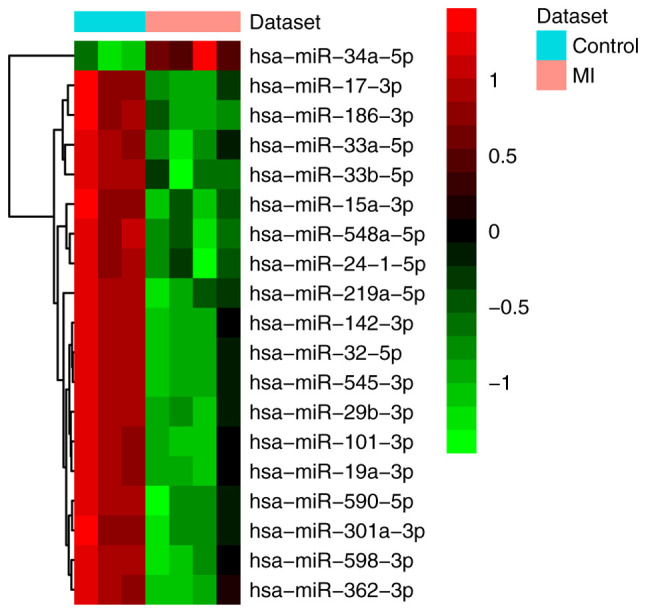
Figure 1.

Heat map of all differentially expressed miRNAs in MI. The differentially expressed miRNA clustering tree is shown on the right. Red, below the reference channel; green, higher than the reference. miRNA/miR, microRNA; MI, myocardial infarction.
