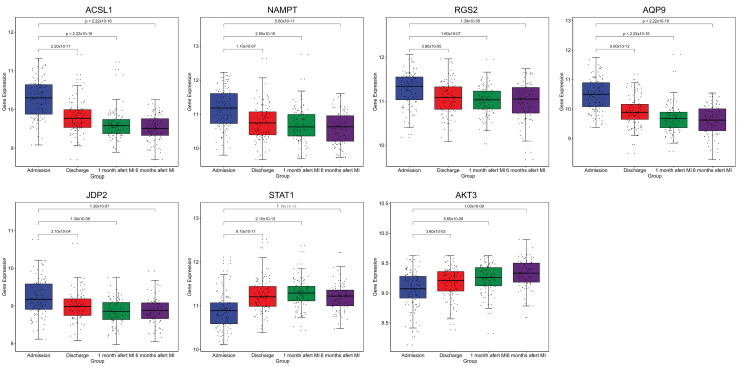
Figure 7.
Box plots of ACSL1, NAMPT, RGS2, AQP9, JDP2, STAT1 and AKT3 expression. The expression levels of ACSL1, NAMPT, RGS2, AQP9, JDP2, STAT1 and AKT3 were determined in the blood of patients with MI at admission (n=111), at discharge (n=101), 1 month after discharge (n=95) and 6 months after discharge (n=83). ACSL1, long-chain-fatty-acid-CoA ligase 1; NAMPT, nicotinamide phosphoribosyltransferase; RGS2, regulator of G-protein signaling 2; JDP2, Jun dimerization protein 2; AQP9, aquaporin-9; MI, myocardial infarction.

