Figure 2.
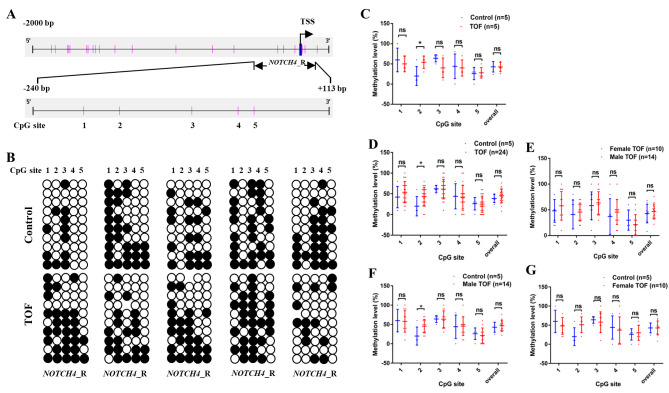
Methylation status of the NOTCH4 promoter region and its association with NOTCH4 protein expression. (A) Schematic representation of NOTCH4_R (−240 to +113 bp, relative to TSS) in the NOTCH4 promoter region (−2,000 to +200 bp, relative to TSS). CpG sites 1–5 within NOTCH4_R are displayed as vertical pink bars. (B) Bisulphite sequencing results for NOTCH4_R methylation in right ventricular outflow tract myocardial tissues from patients with TOF and healthy controls. White and black circles represent unmethylated and methylated CpG sites, respectively. n=5 in each group. (C) Initial screen: Methylation levels in patients with TOF (n=5) and healthy controls (n=5). (D) Second screen: Methylation levels patients with TOF (n=24) and healthy controls (n=5), (E) male (n=14) and female patients with TOF (n=10), and (F) male patients with TOF (n=14) and healthy controls (n=5). (G) Female patients with TOF (n=10) and healthy controls (n=5). Overall NOTCH4_R methylation levels are displayed, together with methylation levels at each CpG site. Data are presented as the mean ± SD. *P<0.05; Mann-Whitney test. TOF, tetralogy of Fallot; TSS, transcription start site.

