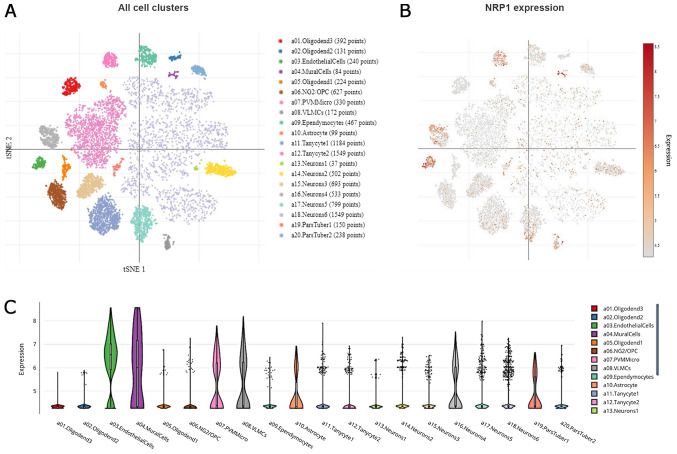
Figure 2.
Single cell analysis of the hypothalamic Arc-ME complex, using the Single Cell Portal, revealed distinct expression of NRP1. (A) Arc-ME single-cell transcriptomics data are displayed as a spectral tSNE plot of 20,921 cells, coloured per density clustering and annotated according to known cell types. (B) Sub-populations of cell types which are enriched for NRP1 expression, with expression intensity demonstrated by a heat map. (C) Single cell analysis of the hypothalamic Arc-ME complex, using the Single Cell Portal, enriched for population subtypes, represented as violin plots. Arc-ME, arcuate and median eminence; tSNE, T-distributed Stochastic Neighbor Embedding.

