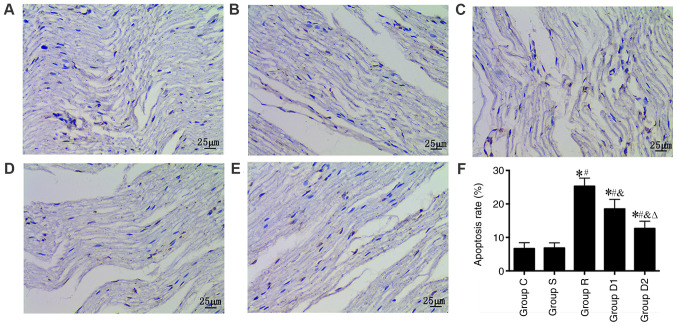
Figure 4.
Comparison of the rate of apoptosis in the rats as measured via TUNEL staining (n=8). (A) Control, (B) sham, (C) ropivacaine, (D) low-dose dexmedetomidine and (E) high-dose dexmedetomidine groups (magnification, ×400). (F) Quantification of the rate of apoptosis. *P<0.05 vs. group C; #P<0.05 vs. group S; &P<0.05 vs. group R; ∆P<0.05 vs. group D1. Group C, control group; group S, sham group; group R, ropivacaine group; group D1, low-dose dexmedetomidine group; group D2, high-dose dexmedetomidine group.

