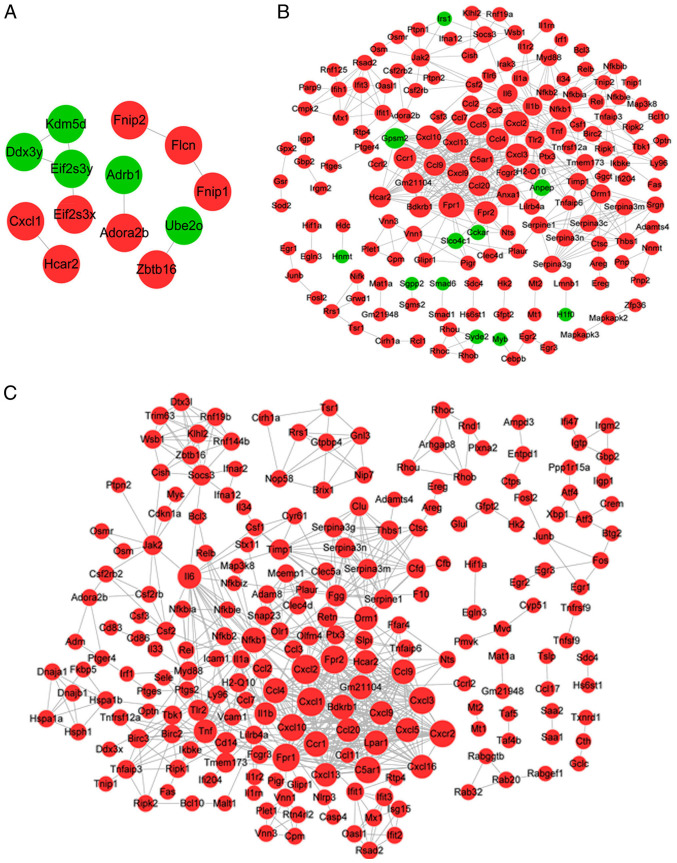
Figure 3.
PPI networks. (A) The PPI network for genes related to MV. (B) The PPI network for genes related to LPS. (C) The PPI network for genes related to LPS + MV. Red indicates upregulation, green indicates downregulation, black lines indicate PPI, and node size indicates connectivity. PPI, protein-protein interaction; MV, mechanical ventilation; LPS, lipopolysaccharide.

