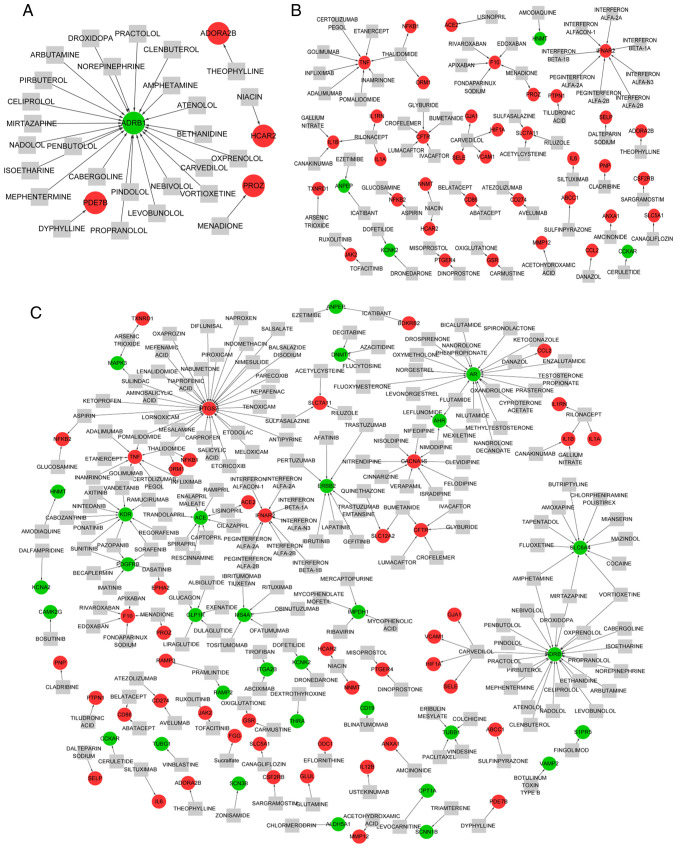
Figure 5.
Drug-gene interaction networks. (A) The drug-gene interaction network for genes related to M. (B) The drug-gene interaction network for genes related to LPS. (C) The drug-gene interaction network for genes related to LPS+MV. Red circles indicate upregulated target genes, green circles indicate downregulated target genes, gray squares indicate predicted drugs. MV, mechanical ventilation; LPS, lipopolysaccharide.

