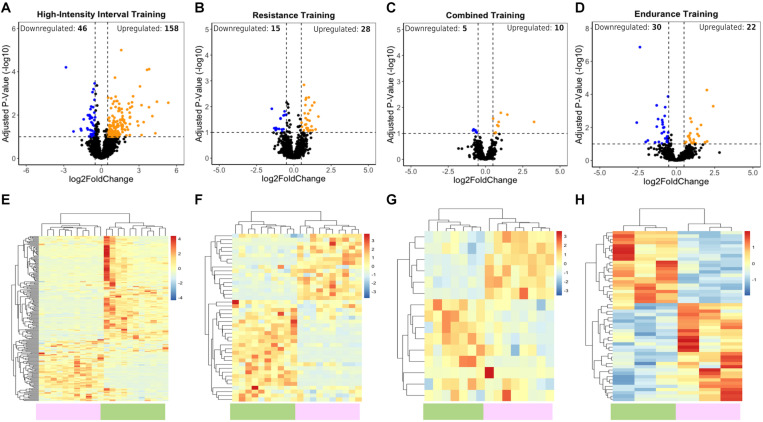
FIGURE 1.
LncRNA transcriptome profiles associated with HIIT, RT, CT, and ET exercises. (A–D) Volcano plots show upregulated (orange) and downregulated (blue) DELs. Vertical dotted lines represent the log2-fold change cutoff (right and left), and values above the horizontal dotted lines represent lncRNAs with adjusted P-value < 0.1. (E–H) Heatmaps showing normalized differentially expressed lncRNAs between the posttraining (green bar) and baseline (purple bar) samples after HIIT, RT, CT, and ET. Blue indicates low lncRNA expression, and red indicates high lncRNA expression.

